Fig. 5
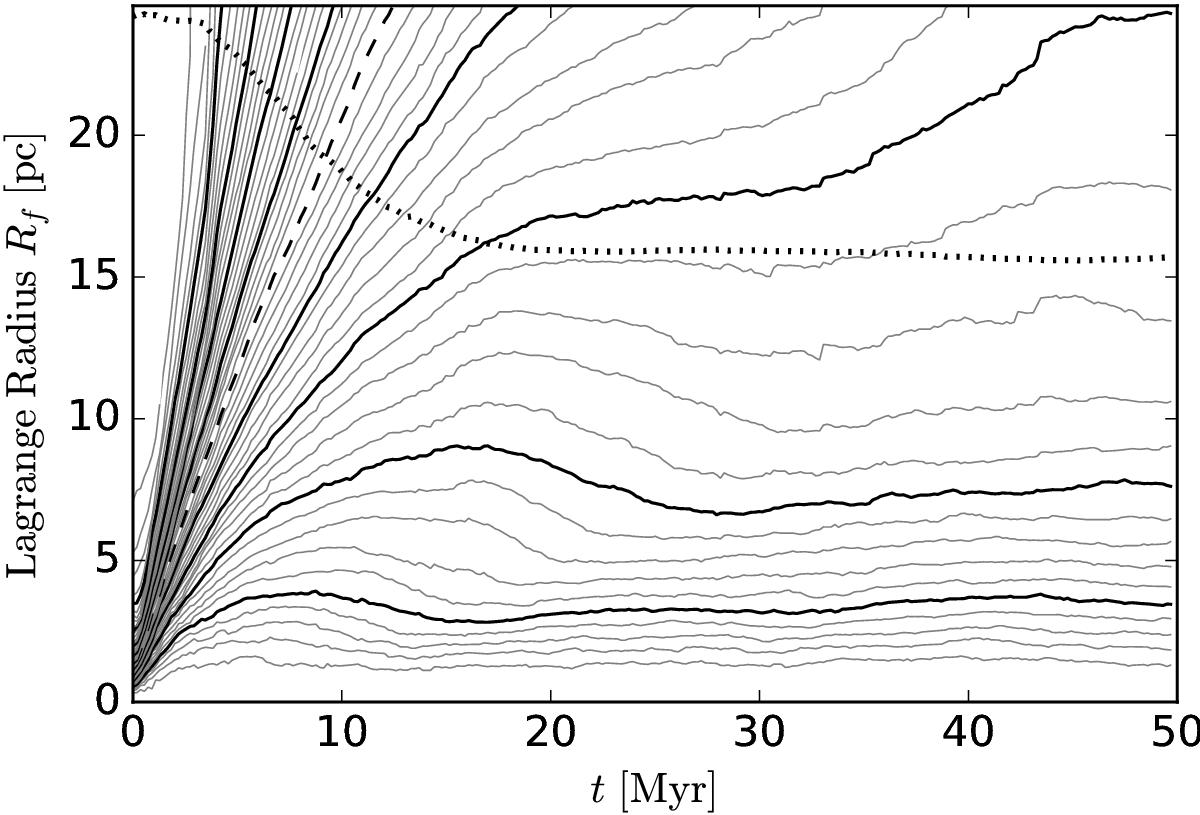
Evolution of a non-isolated cluster of the solar neighborhood with SFEgl = 0.20, M⋆ = 6000 M⊙ and rh/rt = 0.052 over 50 Myr after gas expulsion. We show 49 Lagrange radii, ranging from 2 percent to 98 percent in intervals of 2 percent (solid and dashed lines). The instantaneous tidal radius rt of the cluster is shown as the dotted line. Thick solid lines correspond to every 10 percent of the Lagrange radius, and the dashed line corresponds to 50 percent of the Lagrange radius.
Current usage metrics show cumulative count of Article Views (full-text article views including HTML views, PDF and ePub downloads, according to the available data) and Abstracts Views on Vision4Press platform.
Data correspond to usage on the plateform after 2015. The current usage metrics is available 48-96 hours after online publication and is updated daily on week days.
Initial download of the metrics may take a while.