Fig. 3
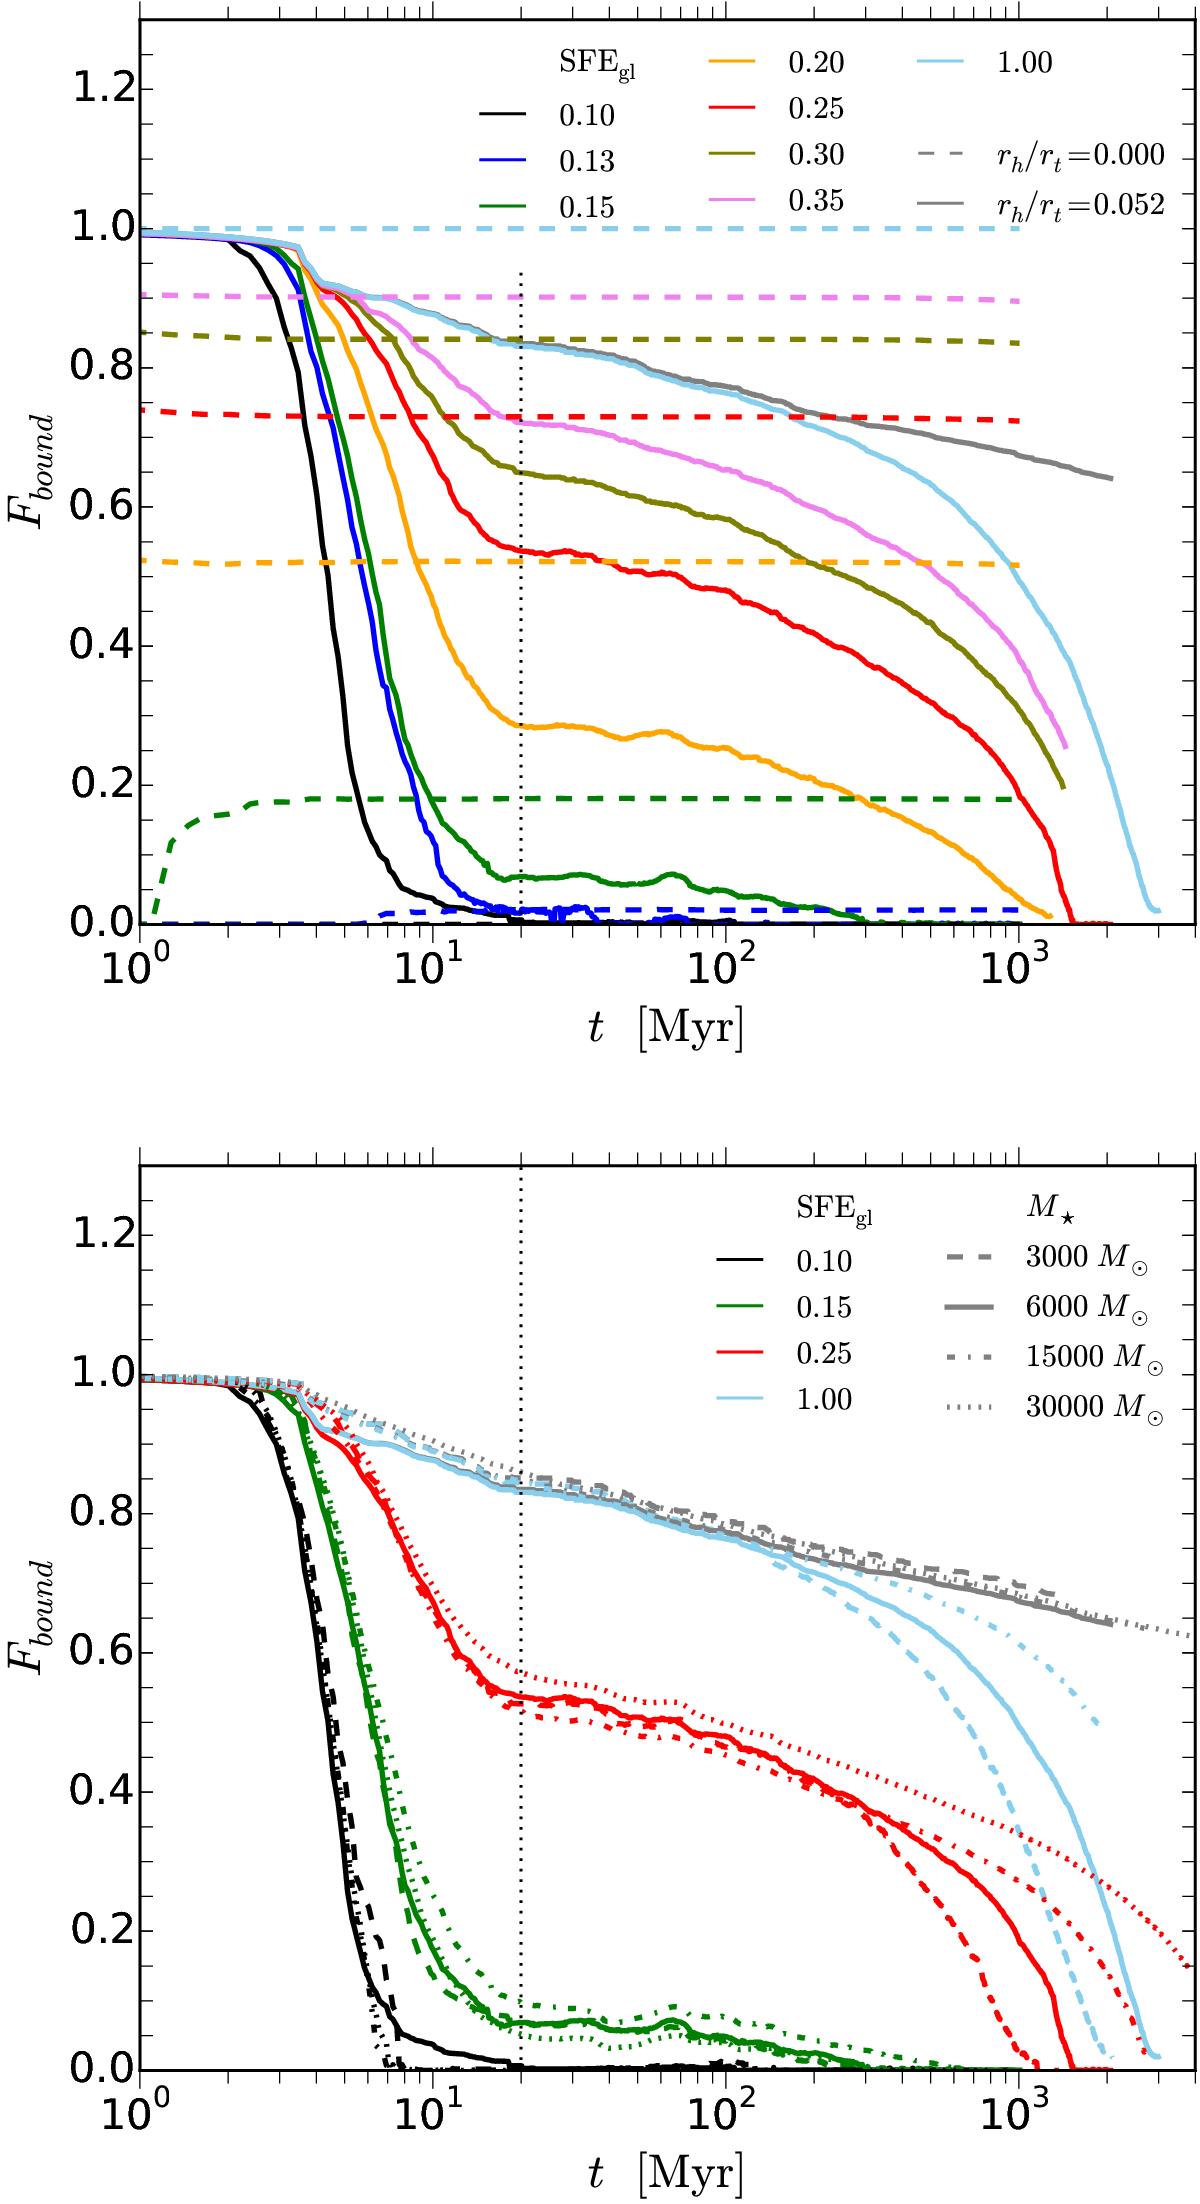
Evolution of the bound fraction of clusters obtained in our simulations. Different colors correspond to different global SFEs (see the key). The gray lines show the impact of mass loss caused by stellar evolution alone. The vertical dotted line corresponds to t = 20 Myr.Top panel: comparison of the bound fraction evolution of isolated (dashed lines) and non-isolated (solid lines) models for M⋆ = 6000 M⊙ with N ≈ 104 stars. Note that the isolated models are the single-mass models without stellar evolution and scaled to the same physical units as the non-isolated models (i.e., M⋆ = 6000 M⊙ and rh = 1.26 pc). Bottom panel: bound fraction (instantaneous tidal mass as a fraction of initial stellar mass) evolution for non-isolated models with different initial stellar masses (see the key for the line-coding).
Current usage metrics show cumulative count of Article Views (full-text article views including HTML views, PDF and ePub downloads, according to the available data) and Abstracts Views on Vision4Press platform.
Data correspond to usage on the plateform after 2015. The current usage metrics is available 48-96 hours after online publication and is updated daily on week days.
Initial download of the metrics may take a while.