Fig. 7
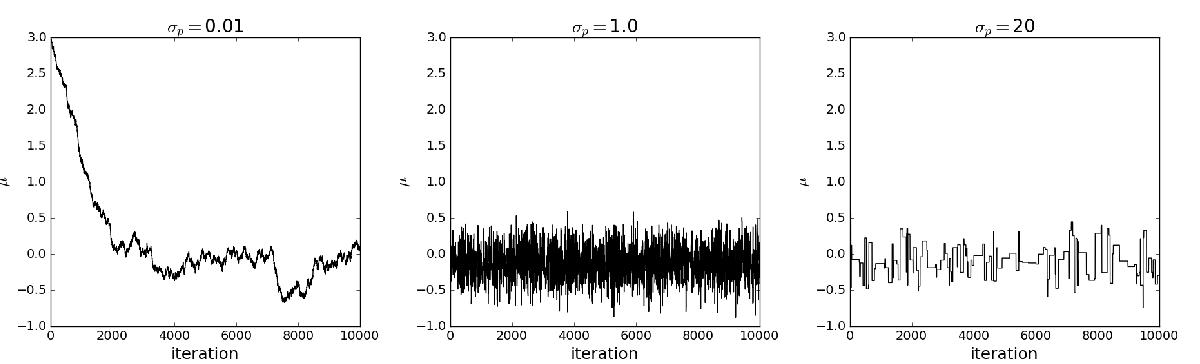
Traceplots depicting three typical situations that can arise in a standard MCMC chain with the (non-adaptive) Metropolis-Hastings algorithm. The input data is a set of 20 points normally distributed with mean 0 and standard deviation 1. The parameter to infer is the mean μ of the input data distribution. The prior is a Normal distribution with mean 0 and standard deviation 1, and the transition kernel is a Normal distribution centered on the current state and width σp. In each case the chain starts from μ = 3 and is run for 10 000 iterations. The target distribution sampled is the same, but the width of the proposal distribution, thatis, the jump size, is different for each case. Left panel: the jump size is too small. The burn-in phase is very long and a much longer chain is needed to sample the target distribution. Central panel: the jump size is optimal, therefore the target distribution is well sampled. Right panel: the jump size is too big. Hence the chain spends a lot of iterations in the same position, which makes the sampling of the target distribution inefficient.
Current usage metrics show cumulative count of Article Views (full-text article views including HTML views, PDF and ePub downloads, according to the available data) and Abstracts Views on Vision4Press platform.
Data correspond to usage on the plateform after 2015. The current usage metrics is available 48-96 hours after online publication and is updated daily on week days.
Initial download of the metrics may take a while.