Fig. 5
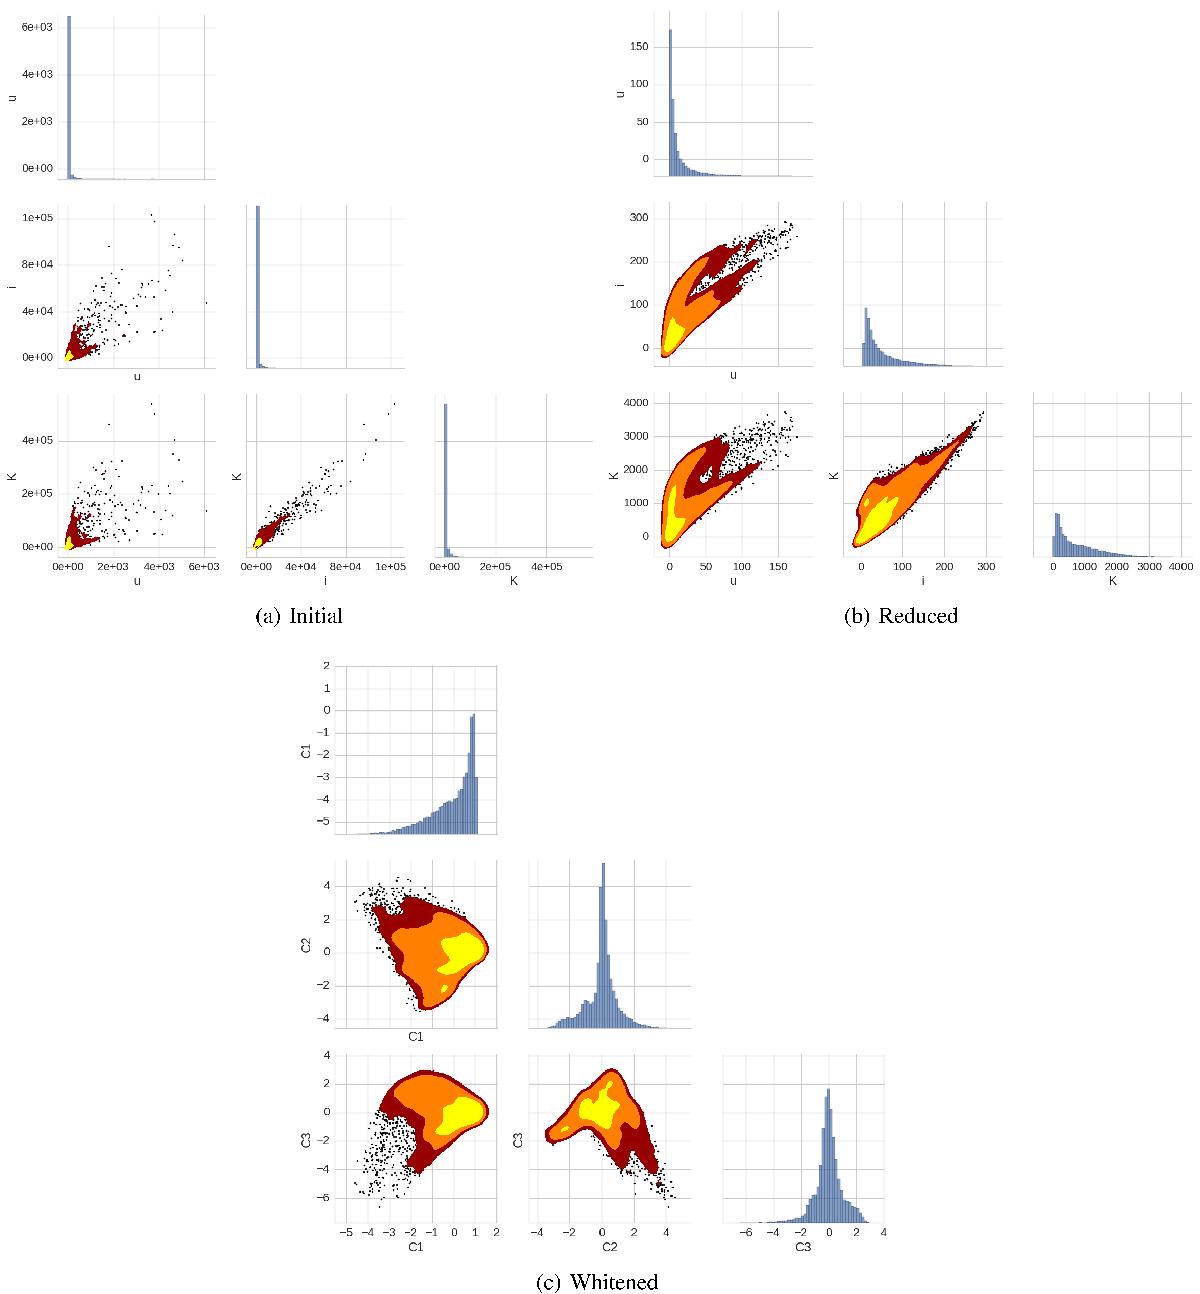
Distribution of observables before and after each step of pre-processing from the mock input data with 2 populations of galaxies (Ellipticals+Spirals) described in Sect. 7.4. The dark red, orange and yellow areas in the contour plots are the regions that enclose 99%, 95% and 68% of the points respectively. Top left panel: scatter plot of the FLUX_AUTO of extracted sources (in ADUs) in filters uiKs and their covariances. Top right panel: same plot, but with the dynamic range of the FLUX_AUTO distributions reduced via Eq. (16). Bottom panel: same plot, after whitening of the reduced distribution of observables. The latter distribution is uncorrelated, centered on the mean of the distribution and rescaled, allowing for a much more efficient binning process than on raw fluxes, and a more practical comparison with the simulated observables.
Current usage metrics show cumulative count of Article Views (full-text article views including HTML views, PDF and ePub downloads, according to the available data) and Abstracts Views on Vision4Press platform.
Data correspond to usage on the plateform after 2015. The current usage metrics is available 48-96 hours after online publication and is updated daily on week days.
Initial download of the metrics may take a while.