Fig. 4
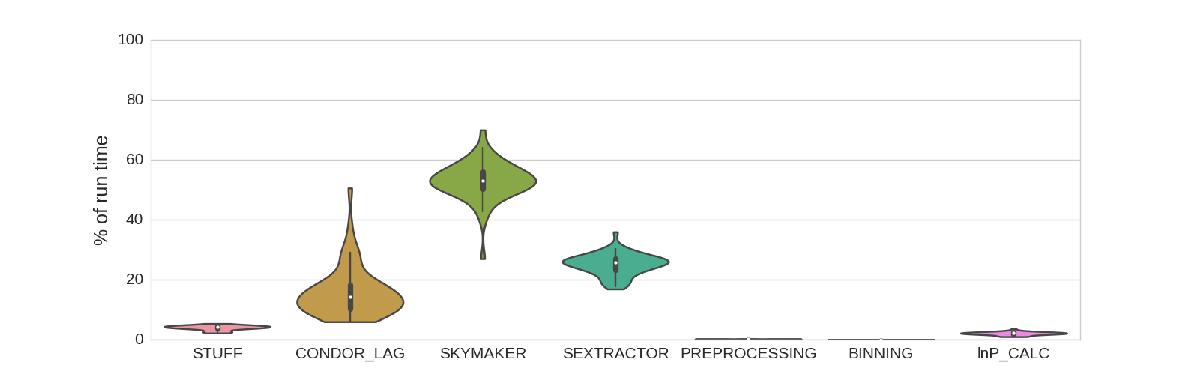
Benchmarking of a full iteration of our pipeline, obtained with 50 realizations of the same iteration. An iteration starts with the Stuff catalog generation (here we consider a case where ~55 000 sources spread into two populations of galaxies are produced), and ends with the posterior density computation. The runtime of each subroutine called is analyzed in terms of the fraction of the total runtime of the iteration. In this scheme, the image simulation step clearly dominates the runtime, followed by the source extraction step and the HTCondor latencies. Source generation, pre-processing, binning and posterior density calculation (labeled lnP_CALC), however, account for a negligible fraction of the total runtime.
Current usage metrics show cumulative count of Article Views (full-text article views including HTML views, PDF and ePub downloads, according to the available data) and Abstracts Views on Vision4Press platform.
Data correspond to usage on the plateform after 2015. The current usage metrics is available 48-96 hours after online publication and is updated daily on week days.
Initial download of the metrics may take a while.