Fig. 2
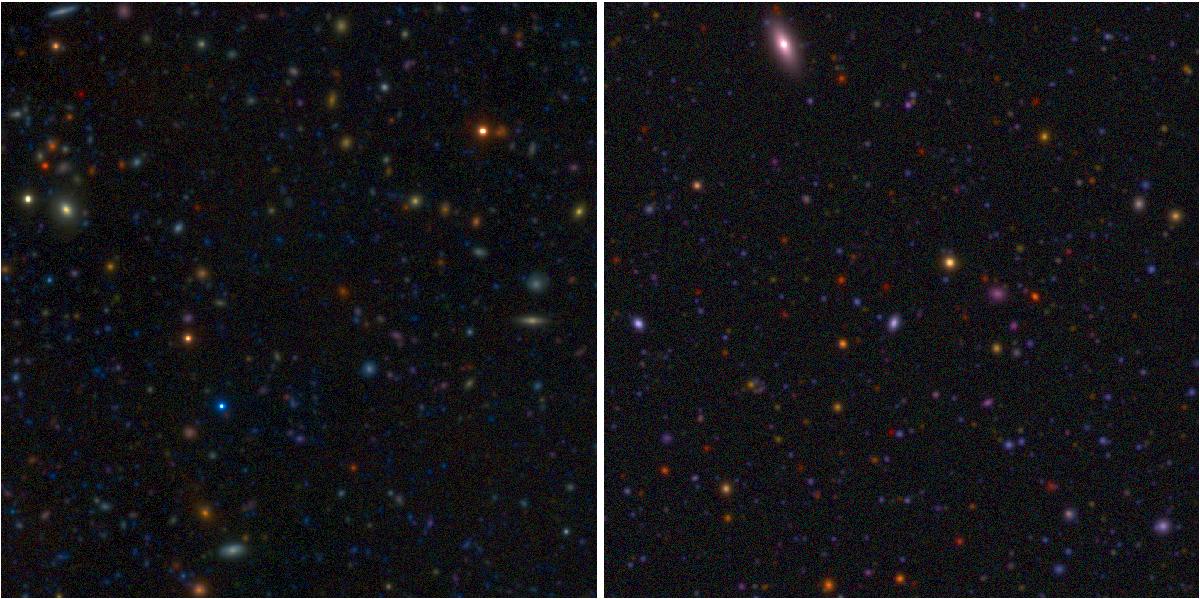
Comparison between an observed survey image and a mock image generated by our model. On the left: a region of the CFHTLS D1 field (stack from the 85% best seeing exposures) built from the gri bands. On the right: a simulated image with Stuff+Skymaker with the same filters, exposure time, and telescope properties as the CFHTLS data. Both images are shown with the same color coding.
Current usage metrics show cumulative count of Article Views (full-text article views including HTML views, PDF and ePub downloads, according to the available data) and Abstracts Views on Vision4Press platform.
Data correspond to usage on the plateform after 2015. The current usage metrics is available 48-96 hours after online publication and is updated daily on week days.
Initial download of the metrics may take a while.