Fig. 12
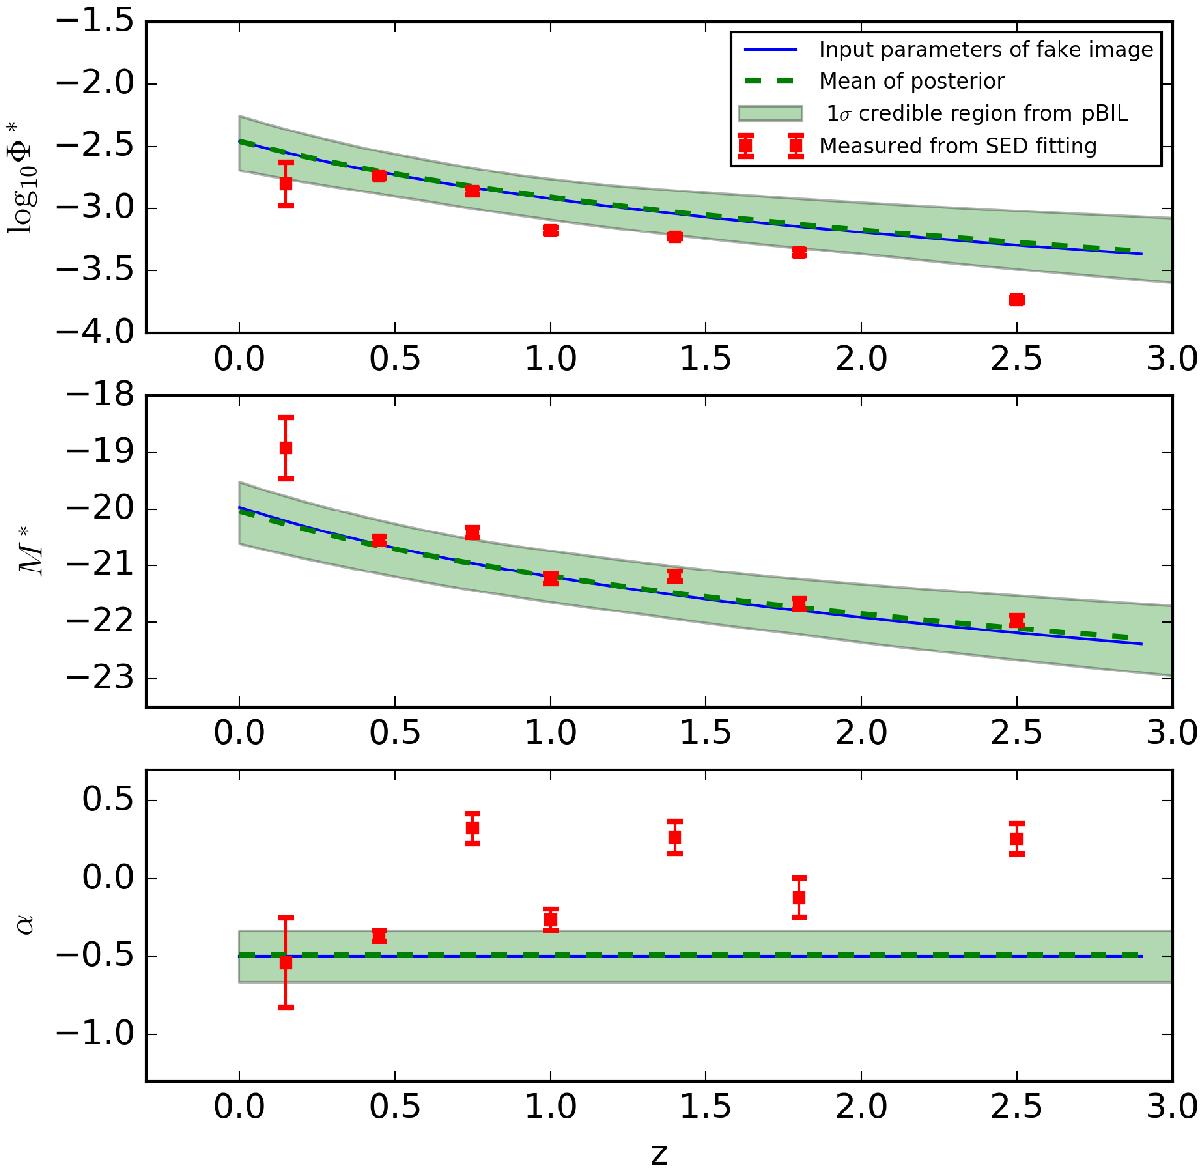
Evolution of the LF parameters as defined in the mock data image (blue solid line) and inferred from the pBIL method in the “Fattening E” population described in Sect. 7.6 (the green dotted line is the mean of the posterior and the shaded area represents the 68% credible region), compared to the direct measurement of the LF obtained per redshift bin and estimated using a Vmax weighting, after determination of the photometric redshifts from SED fitting (red dots).
Current usage metrics show cumulative count of Article Views (full-text article views including HTML views, PDF and ePub downloads, according to the available data) and Abstracts Views on Vision4Press platform.
Data correspond to usage on the plateform after 2015. The current usage metrics is available 48-96 hours after online publication and is updated daily on week days.
Initial download of the metrics may take a while.