Fig. 10
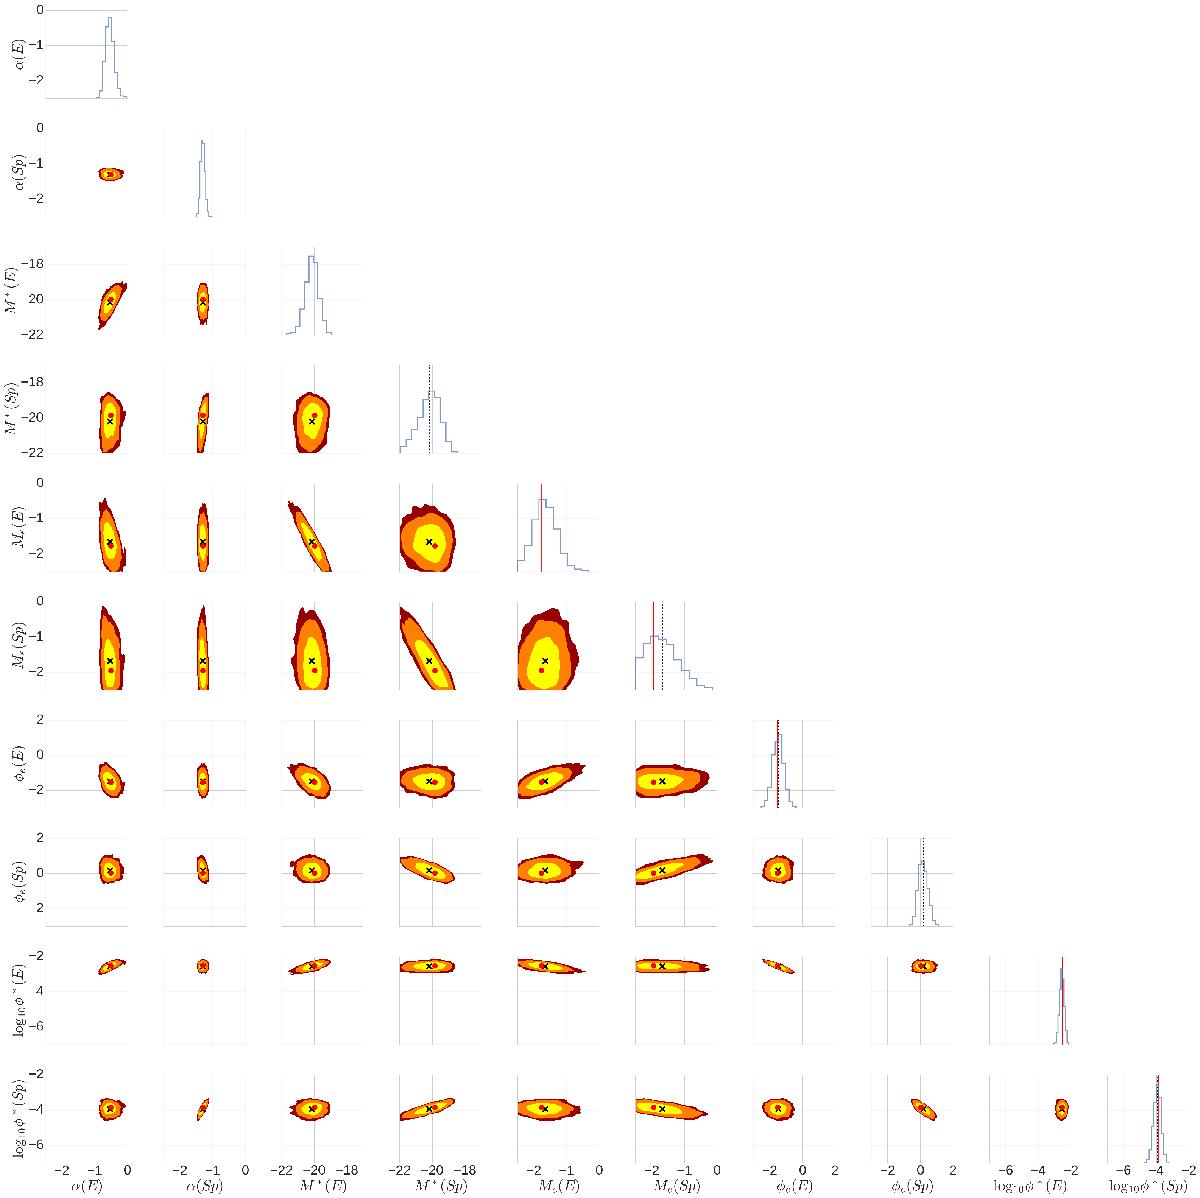
Joint posterior distribution resulting from the “Multi-type” test described in Sect. 7.4. The diagonal plots show the marginal distribution for each parameter (the projection of the posterior onto that parameter). Each panel is bounded by the prior range values. The dark red, orange, and yellow areas in the contour plots represent the 99%, 95%, and 68% credible regions respectively. The black crosses and red dots are the mean of the posterior and input true value respectively. In the marginalized posterior panels, the black dotted and red lines represent the posterior mean and the true value respectively.
Current usage metrics show cumulative count of Article Views (full-text article views including HTML views, PDF and ePub downloads, according to the available data) and Abstracts Views on Vision4Press platform.
Data correspond to usage on the plateform after 2015. The current usage metrics is available 48-96 hours after online publication and is updated daily on week days.
Initial download of the metrics may take a while.