Fig. 4

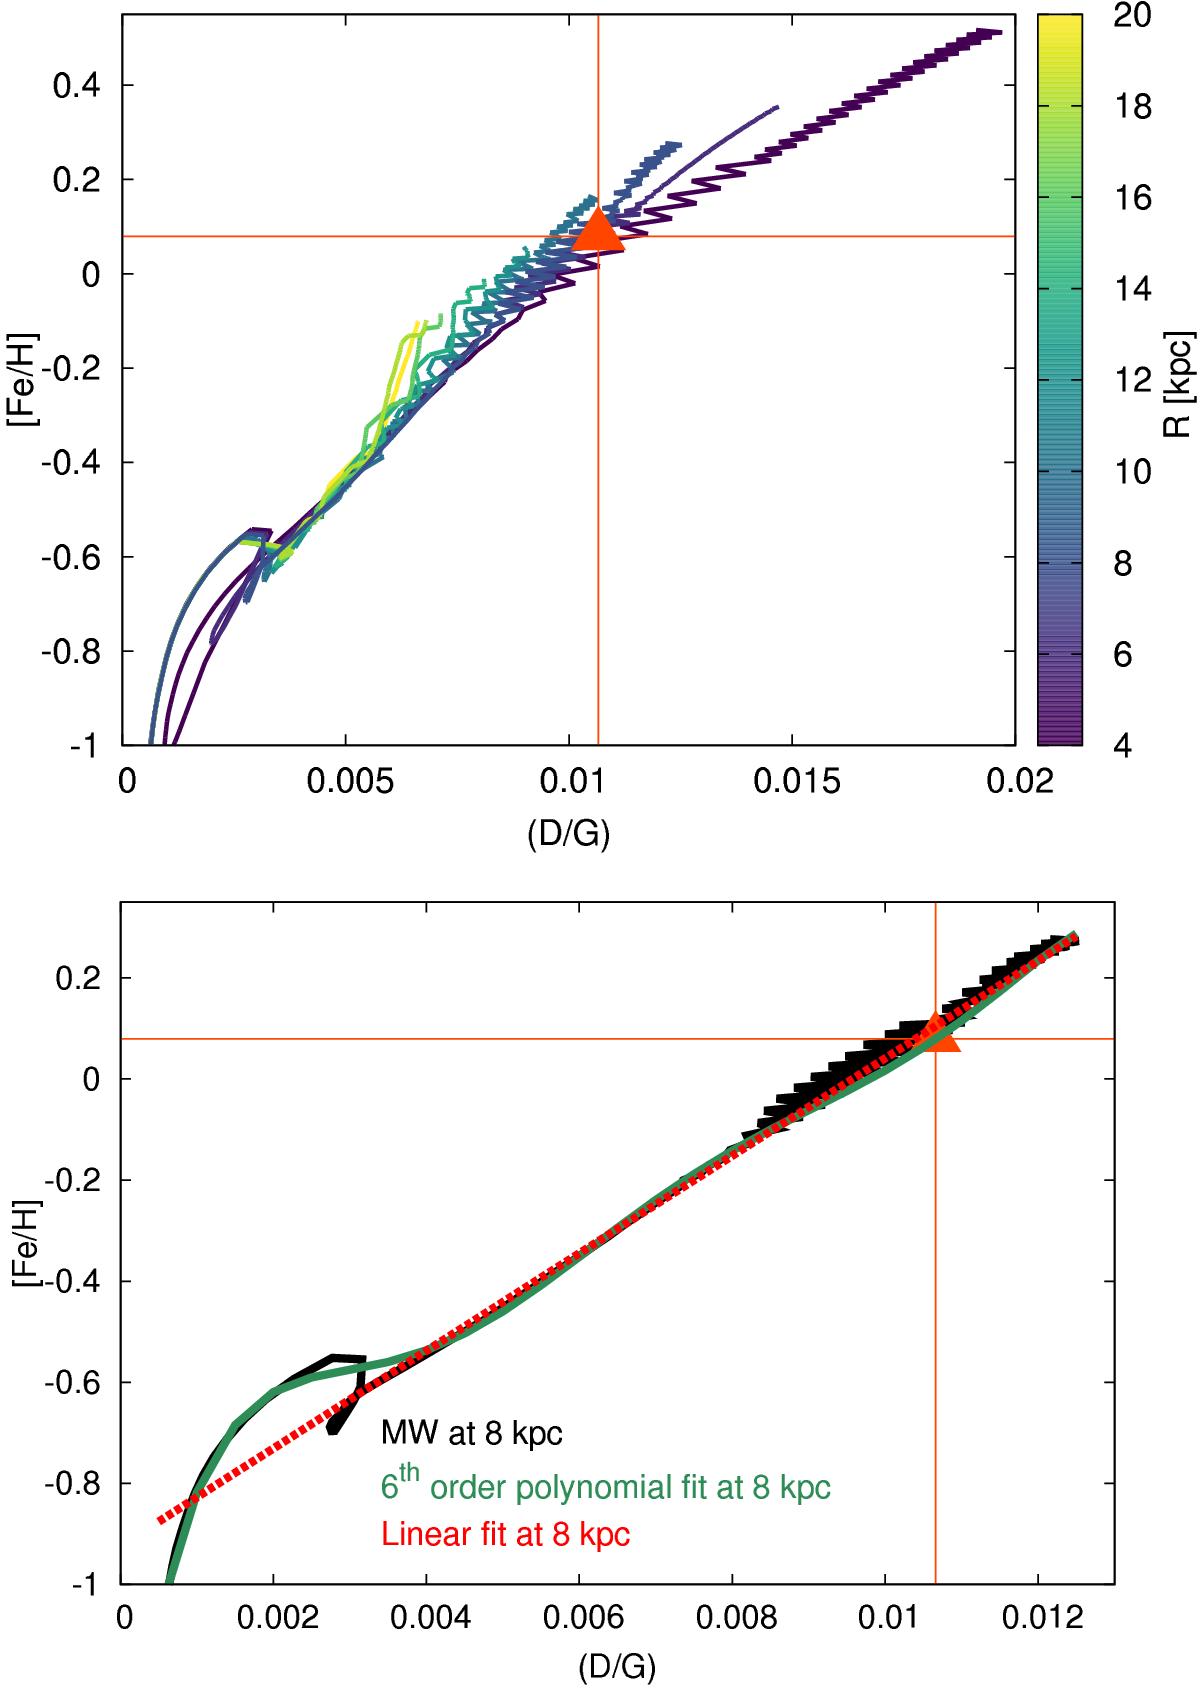
Upper panel: evolution of the abundance ratio [Fe/H] as a function of the dust-to-gas ratio D/G predicted by our chemical evolution model of the Milky Way disk. As in Fig. 1, the color code indicates different Galactocentric distances. Lower panel: with the black solid line we report the [Fe/H] ratio vs. ![]() computed at 8 kpc (solar neighborhood) using the chemical evolution model of the Milky Way. With the green solid line we show the fit obtained by means of a sixth-order polynomial fit. With the red dashed line we report the linear fit at 8 kpc. In both panels with the orange triangle we label the value of the [Fe/H] as a function of the dust-to-gas ratio D/G for the model computed in the solar neighborhood at the Galactic time of 9.5 Gyr (i.e., model solar value).
computed at 8 kpc (solar neighborhood) using the chemical evolution model of the Milky Way. With the green solid line we show the fit obtained by means of a sixth-order polynomial fit. With the red dashed line we report the linear fit at 8 kpc. In both panels with the orange triangle we label the value of the [Fe/H] as a function of the dust-to-gas ratio D/G for the model computed in the solar neighborhood at the Galactic time of 9.5 Gyr (i.e., model solar value).
Current usage metrics show cumulative count of Article Views (full-text article views including HTML views, PDF and ePub downloads, according to the available data) and Abstracts Views on Vision4Press platform.
Data correspond to usage on the plateform after 2015. The current usage metrics is available 48-96 hours after online publication and is updated daily on week days.
Initial download of the metrics may take a while.


