Free Access
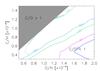
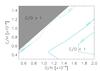
Fig. A.3
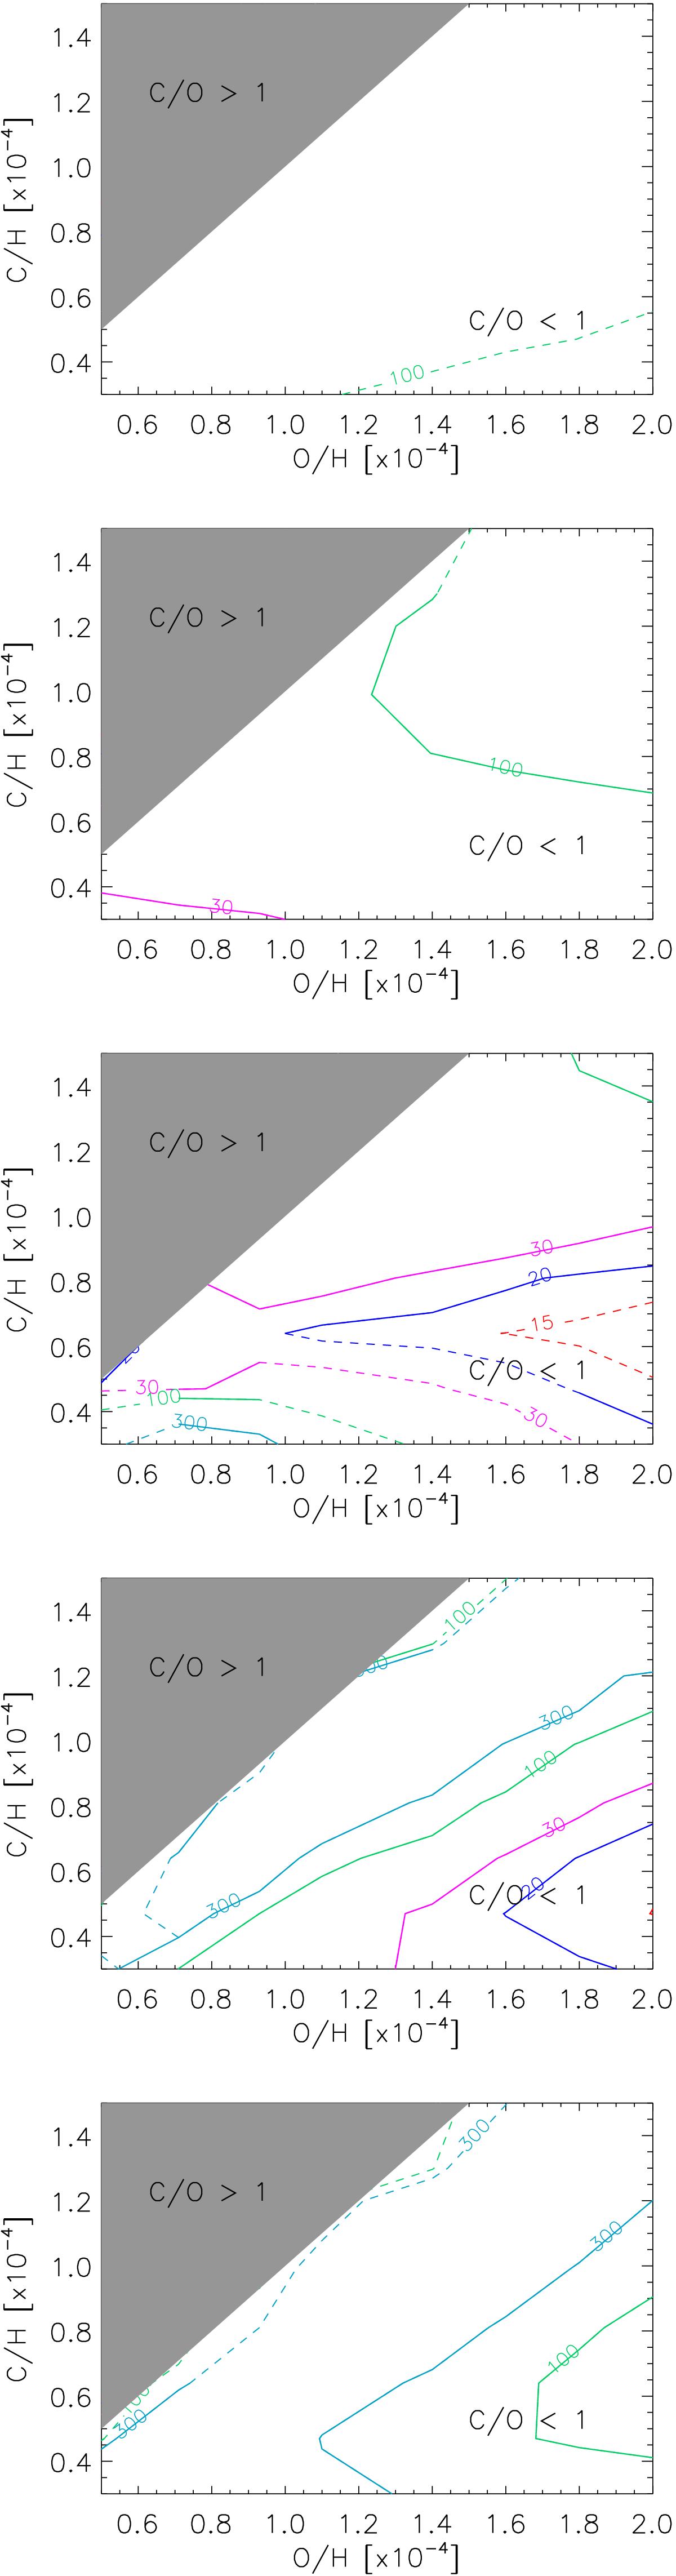
Predictions of the HC3N/HC5N abundance ratio from the chemical models described in Sect. 3.2 for ζ = 1 × 10-17 at the five different times (from top to bottom): 1 × 10⁴ yr, 3 × 10⁴ yr, 1 × 10⁵ yr, 3 × 10⁵ yr, and 1 × 10⁶ yr. All symbols used (contour plots, grey zone, etc.) are the same as in Fig. 3.
This figure is made of several images, please see below:
Current usage metrics show cumulative count of Article Views (full-text article views including HTML views, PDF and ePub downloads, according to the available data) and Abstracts Views on Vision4Press platform.
Data correspond to usage on the plateform after 2015. The current usage metrics is available 48-96 hours after online publication and is updated daily on week days.
Initial download of the metrics may take a while.