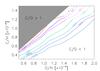
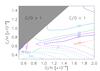
Fig. 3

Contour plots of the HC3N/HC5N abundance ratio as a function of the O/H and C/H gaseous elemental abundance. The grey zone marks the region where the C/O elemental ratio is ≥1, which is unrealistic (see text). The solid lines mark the loci where the HC3N abundance is equal to the measured one, namely between 0.5 and 5 × 10-11. The models were obtained for a gas temperature of 40 K and a H2 density of 1.2 × 106 cm-3, valid for the envelope of FIR4 (Ceccarelli et al. 2014). Left panel: solution for FIR4-HC5N and FIR5, where the the measured HC3N/HC5N abundance ratio is 4–12 and ≤6, respectively. The cosmic-ray ionisation rate is 4 × 10-14 s-1 and the time is 3 × 10⁴ yr. Right panel: a possible solution for FIR4-lowHC5N, where the measured HC3N/HC5N abundance ratio is 10–30. The cosmic-ray ionisation rate is 1 × 10-17 s-1 and the time is 1 × 10⁵ yr.
Current usage metrics show cumulative count of Article Views (full-text article views including HTML views, PDF and ePub downloads, according to the available data) and Abstracts Views on Vision4Press platform.
Data correspond to usage on the plateform after 2015. The current usage metrics is available 48-96 hours after online publication and is updated daily on week days.
Initial download of the metrics may take a while.