Fig. 7
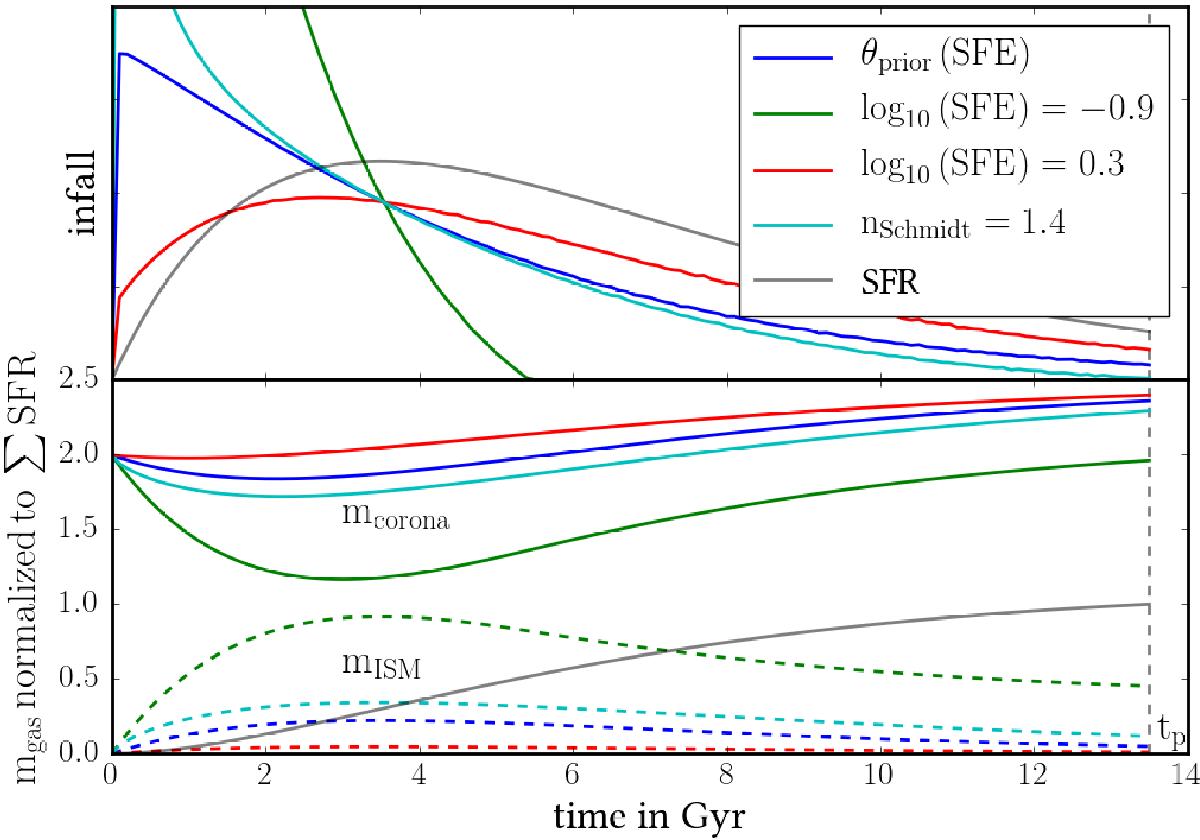
Illustration of how the gas infall and the gas masses (of ISM and corona) are governed by the model parameter “star formation efficiency”, θ4 = SFE. The upper panel shows the infall over time for ![]() and ± 2σprior deviations. For comparison, a model with
and ± 2σprior deviations. For comparison, a model with ![]() but a Schmidt law exponent of 1.4 instead of our default 1.0 is shown (then the SFE parameter is no longer equal to the star formation efficiency). In the lower panel, gas mass of the corona (solid lines) and the ISM (dashed lines) are depicted for the four different cases from above, normalized to
but a Schmidt law exponent of 1.4 instead of our default 1.0 is shown (then the SFE parameter is no longer equal to the star formation efficiency). In the lower panel, gas mass of the corona (solid lines) and the ISM (dashed lines) are depicted for the four different cases from above, normalized to ![]() . The SFR and its cumulative version are plotted in the upper and lower panel, respectively.
. The SFR and its cumulative version are plotted in the upper and lower panel, respectively.
Current usage metrics show cumulative count of Article Views (full-text article views including HTML views, PDF and ePub downloads, according to the available data) and Abstracts Views on Vision4Press platform.
Data correspond to usage on the plateform after 2015. The current usage metrics is available 48-96 hours after online publication and is updated daily on week days.
Initial download of the metrics may take a while.