Fig. 17
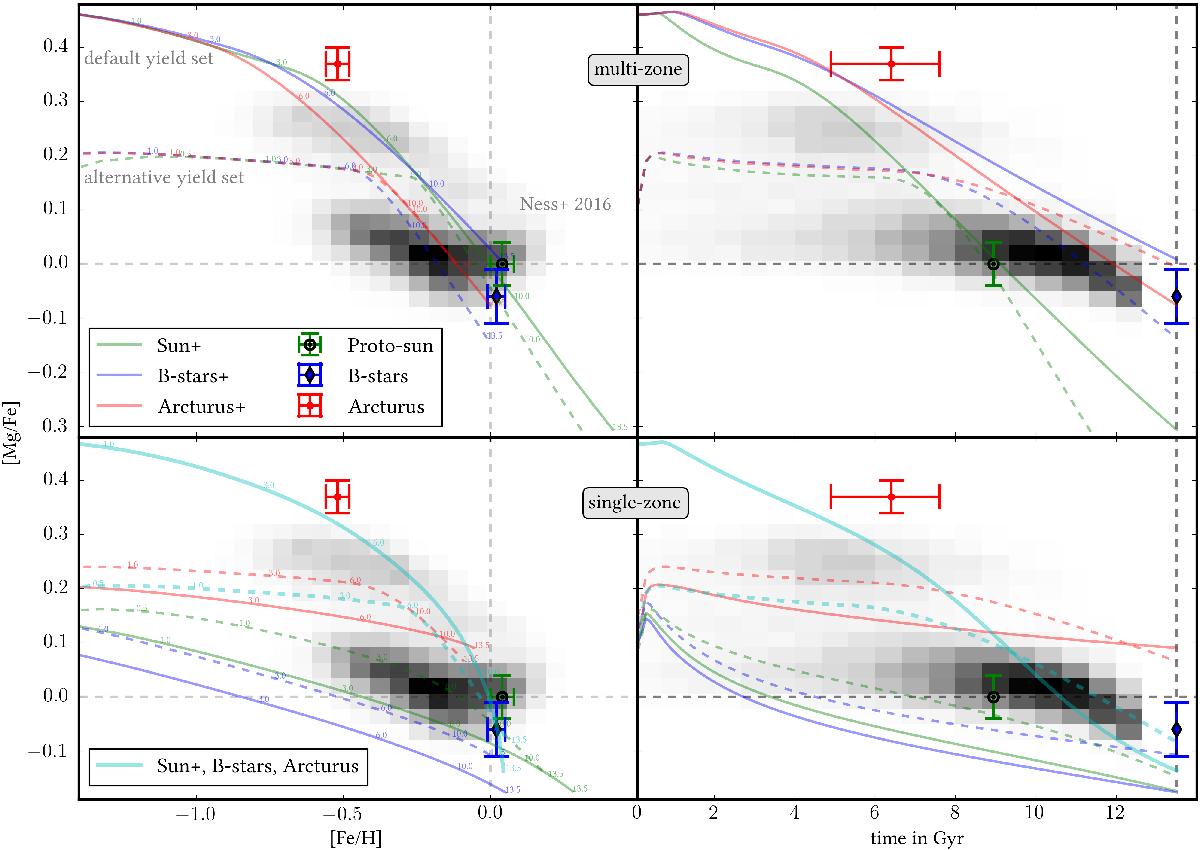
Tracks of the ISM abundances evolution implied by the Chempy fits, represented by a track in the [Mg/Fe]–[Fe/H] (left) and the [Mg/Fe]–time (right) panels. Shown are the predictions for the median inferred parameters ![]() coming from the multi-zone (upper panels) and the single-zones (lower panels, their colors are the same as in Fig. 16) inference. The default and alternative yield set are plotted in solid and dashed lines respectively. The current simulation time is written in small letters next to the chemical abundance tracks. Our observational data, used for the fitting procedure, is shown with error bars. For comparison the distribution of ~ 20 000 APOGEE giants from Ness et al. (2016) are shown as a gray shaded area. The evolutionary tracks of the separate single-zones are flatter compared to the multi-zone tracks because of the almost “prompt” SNe Ia. The evolutionary track of the solid cyan line, where Sun+, B-stars, and Arcturus are included in a single zone using the default yield set, is so steep because the SFR ceases after ~8 Gyr, only leaving SNe Ia contributing to the enrichment. We keep in mind that all the elemental abundances (+SN-ratio and Zcorona) are fit for simultaneously, so a trade-off between all those constraints and the prior distribution is found by the MCMC.
coming from the multi-zone (upper panels) and the single-zones (lower panels, their colors are the same as in Fig. 16) inference. The default and alternative yield set are plotted in solid and dashed lines respectively. The current simulation time is written in small letters next to the chemical abundance tracks. Our observational data, used for the fitting procedure, is shown with error bars. For comparison the distribution of ~ 20 000 APOGEE giants from Ness et al. (2016) are shown as a gray shaded area. The evolutionary tracks of the separate single-zones are flatter compared to the multi-zone tracks because of the almost “prompt” SNe Ia. The evolutionary track of the solid cyan line, where Sun+, B-stars, and Arcturus are included in a single zone using the default yield set, is so steep because the SFR ceases after ~8 Gyr, only leaving SNe Ia contributing to the enrichment. We keep in mind that all the elemental abundances (+SN-ratio and Zcorona) are fit for simultaneously, so a trade-off between all those constraints and the prior distribution is found by the MCMC.
Current usage metrics show cumulative count of Article Views (full-text article views including HTML views, PDF and ePub downloads, according to the available data) and Abstracts Views on Vision4Press platform.
Data correspond to usage on the plateform after 2015. The current usage metrics is available 48-96 hours after online publication and is updated daily on week days.
Initial download of the metrics may take a while.