Fig. 14
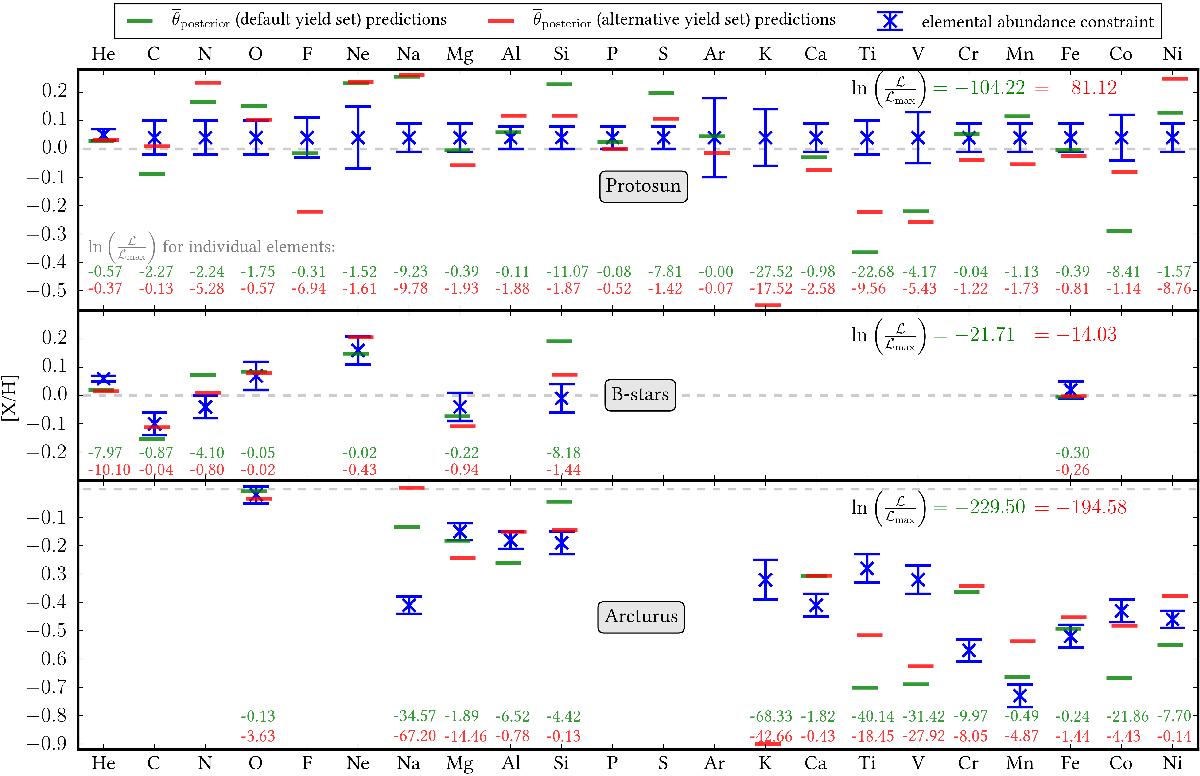
Chempy abundance predictions (for the medians of the marginalized posterior PDFs, ![]() ), compared to the observed stellar abundances. The top row compares the predicted (red, green) and observed (blue) abundances for the Sun, after optimizing for Sun+ constraints; the central panel shows an analogous comparison for the B-stars, and the bottom panel for Arcturus. Predictions for the default yield set are shown in green; for the alternate yield set in red. The log likelihood coming from each individual element as well as the sum of all are indicated. In general, the default and alternate yield sets fit comparably well (or poorly). The predictions for some elements, for example, Na, K, Ti, and V are poor, for both yield sets and for Sun+ and Arcturus+. This implies that some abundances simply cannot be reproduced in the context of GCE models, even if a model as flexible as Chempy is applied.
), compared to the observed stellar abundances. The top row compares the predicted (red, green) and observed (blue) abundances for the Sun, after optimizing for Sun+ constraints; the central panel shows an analogous comparison for the B-stars, and the bottom panel for Arcturus. Predictions for the default yield set are shown in green; for the alternate yield set in red. The log likelihood coming from each individual element as well as the sum of all are indicated. In general, the default and alternate yield sets fit comparably well (or poorly). The predictions for some elements, for example, Na, K, Ti, and V are poor, for both yield sets and for Sun+ and Arcturus+. This implies that some abundances simply cannot be reproduced in the context of GCE models, even if a model as flexible as Chempy is applied.
Current usage metrics show cumulative count of Article Views (full-text article views including HTML views, PDF and ePub downloads, according to the available data) and Abstracts Views on Vision4Press platform.
Data correspond to usage on the plateform after 2015. The current usage metrics is available 48-96 hours after online publication and is updated daily on week days.
Initial download of the metrics may take a while.