Fig. 12
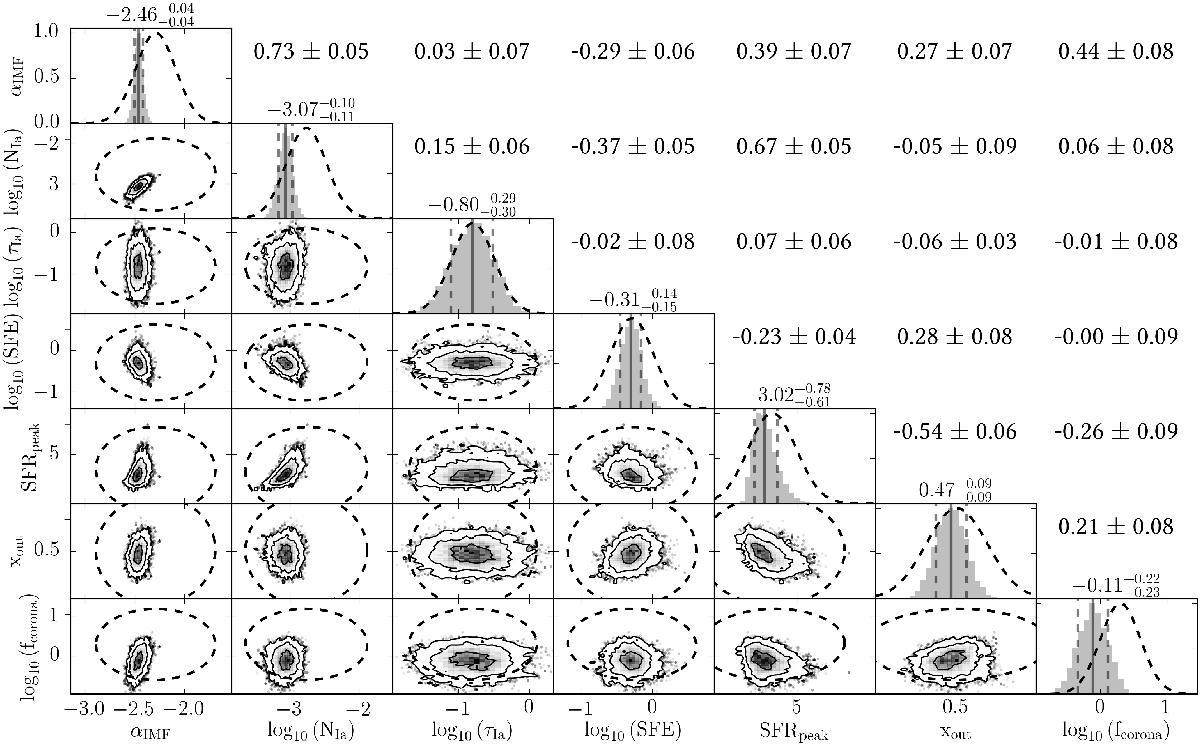
Marginalized parameter distribution derived from the Sun+ constraints, in comparison to the prior distribution. Each contour plot in the lower left shows the projected 2D parameter density distribution with 1, 2, and 3σ contours, with individual PDF sample points beyond (Foreman-Mackey 2016). The 3σ ellipse from the prior run is shown in dashed black. The respective correlation coefficients (Pearson’s r) are given at the upper right together with the standard deviation from ten identical inferences. Histograms of the marginalized parameter distributions are given on the diagonal together with the Gaussian distribution of the prior which is shown in dashed black. The median and the 16 and 84 percentiles of each parameter PDF are given above the histogram and indicated as solid and dashed gray lines.
Current usage metrics show cumulative count of Article Views (full-text article views including HTML views, PDF and ePub downloads, according to the available data) and Abstracts Views on Vision4Press platform.
Data correspond to usage on the plateform after 2015. The current usage metrics is available 48-96 hours after online publication and is updated daily on week days.
Initial download of the metrics may take a while.