Fig. 2
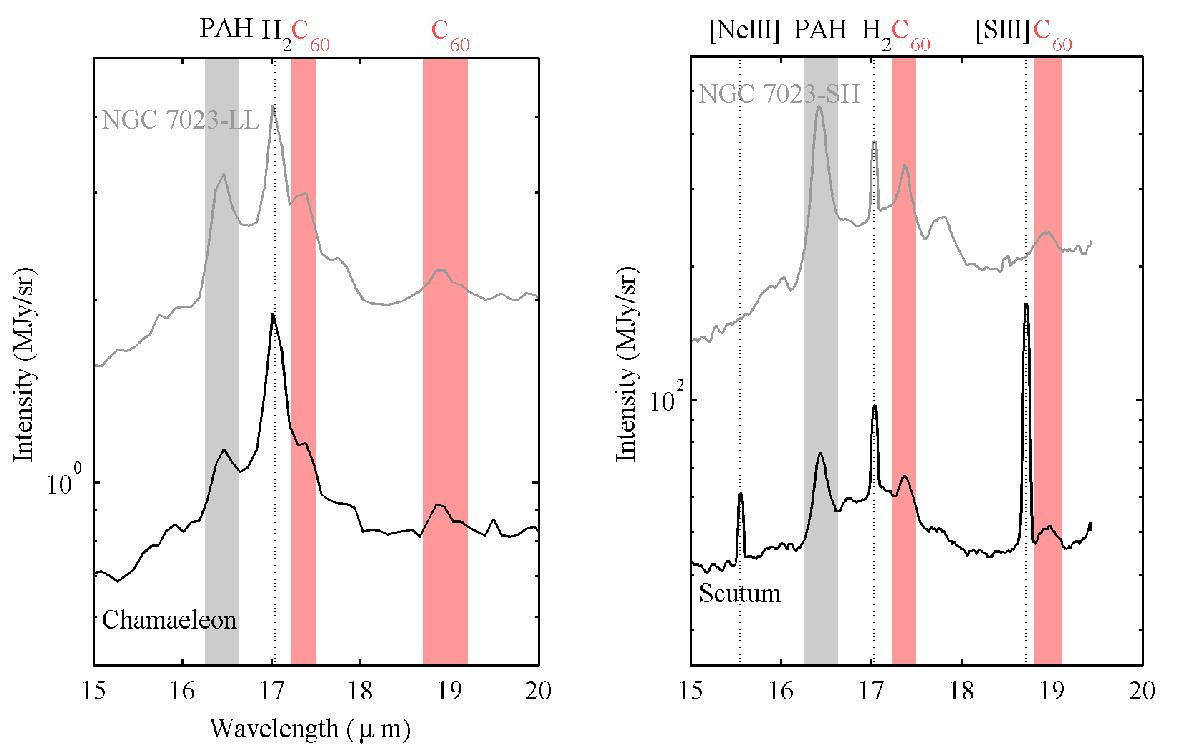
Mid-infrared spectra extracted over the 15−20 μm range for both lines of sight (see Appendix A for details). The spectrum of the NGC 7023 nebula where C60 emission has been reported (Sellgren et al. 2010) is shown as a reference. The Chamaeleon spectrum is compared with a low resolution spectrum (IRS-LL) of NGC 7023, while the Scutum line of sight spectrum is compared to a medium resolution spectrum (IRS-SH) of NGC 7023, to be consistent with the observing modes used to obtain the spectra of interest here (see Appendix A). The positions of the C60 vibrational bands are indicated with red vertical patches. The 16.4 μm attributed to PAH emission is indicated with a grey patch. Spectrally unresolved lines of molecular hydrogen and ions are also indicated with vertical dotted lines.
Current usage metrics show cumulative count of Article Views (full-text article views including HTML views, PDF and ePub downloads, according to the available data) and Abstracts Views on Vision4Press platform.
Data correspond to usage on the plateform after 2015. The current usage metrics is available 48-96 hours after online publication and is updated daily on week days.
Initial download of the metrics may take a while.