Fig. 1
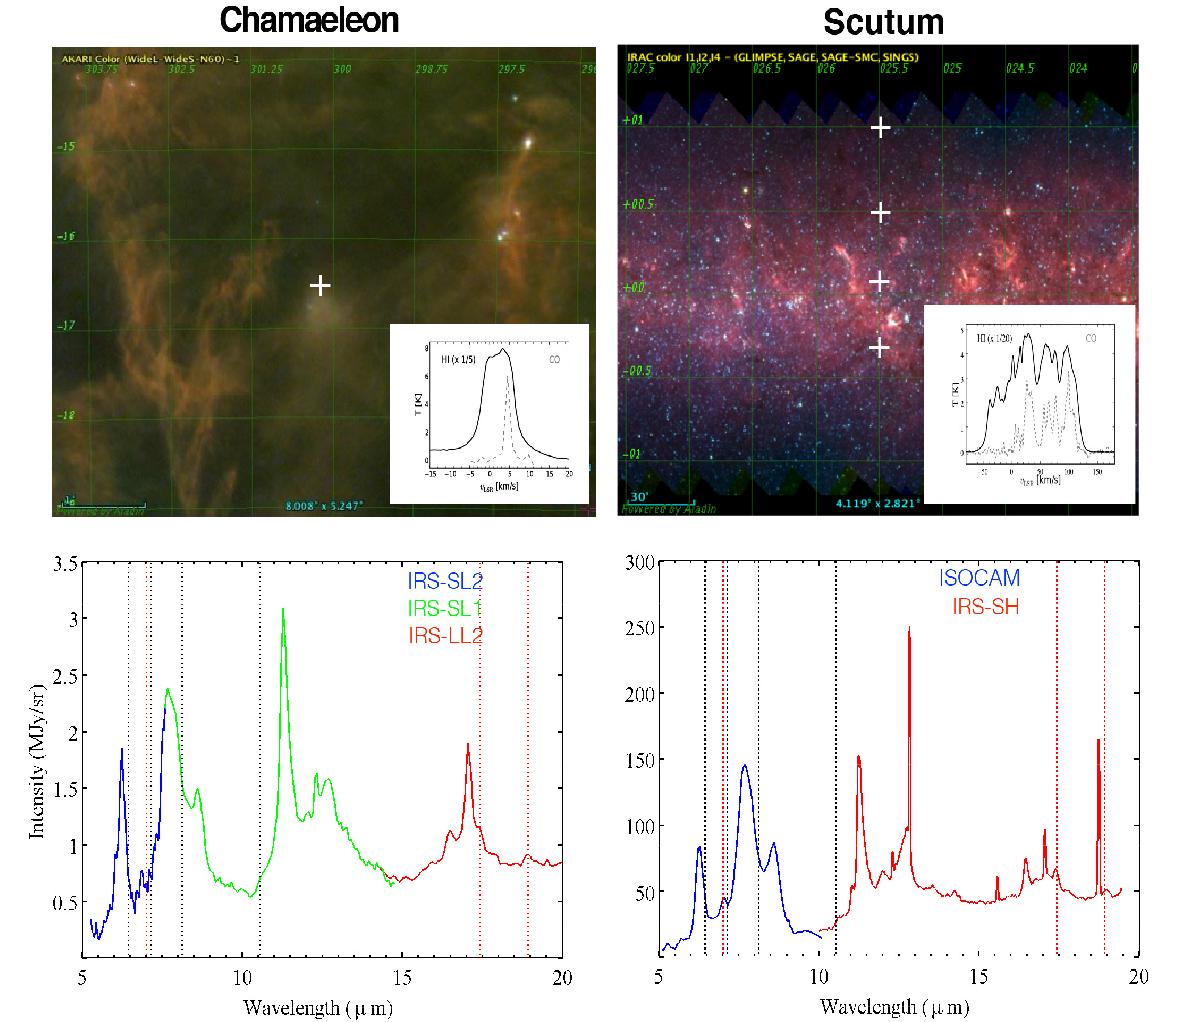
Upper panels: images of the Chamaeleon (translucent) and Scutum (diffuse) lines of sight studied in this article, observed with Spitzer-IRAC (Werner et al. 2004a; Fazio et al. 2004). Positions of the spectroscopic observations are indicated with white crosses. The images show IRAC colours red = 8.0 μm, green = 4.5 μm, and blue = 3.6 μm. Inserts show the HI and CO emission spectra (McClure-Griffiths et al. 2009; Dame et al. 2001; Boulanger et al. 1998). Lower panels: mid-infrared spectra towards the studied lines of sight are represented. The vertical lines indicate the positions of C60 (red) and C![]() (black) bands observed in the NGC 7023 reflection nebula (Sellgren et al. 2010; Berné et al. 2013). The band at 7.0 μm observed in the diffuse line of sight is due to [ArII].
(black) bands observed in the NGC 7023 reflection nebula (Sellgren et al. 2010; Berné et al. 2013). The band at 7.0 μm observed in the diffuse line of sight is due to [ArII].
Current usage metrics show cumulative count of Article Views (full-text article views including HTML views, PDF and ePub downloads, according to the available data) and Abstracts Views on Vision4Press platform.
Data correspond to usage on the plateform after 2015. The current usage metrics is available 48-96 hours after online publication and is updated daily on week days.
Initial download of the metrics may take a while.