Fig. 3
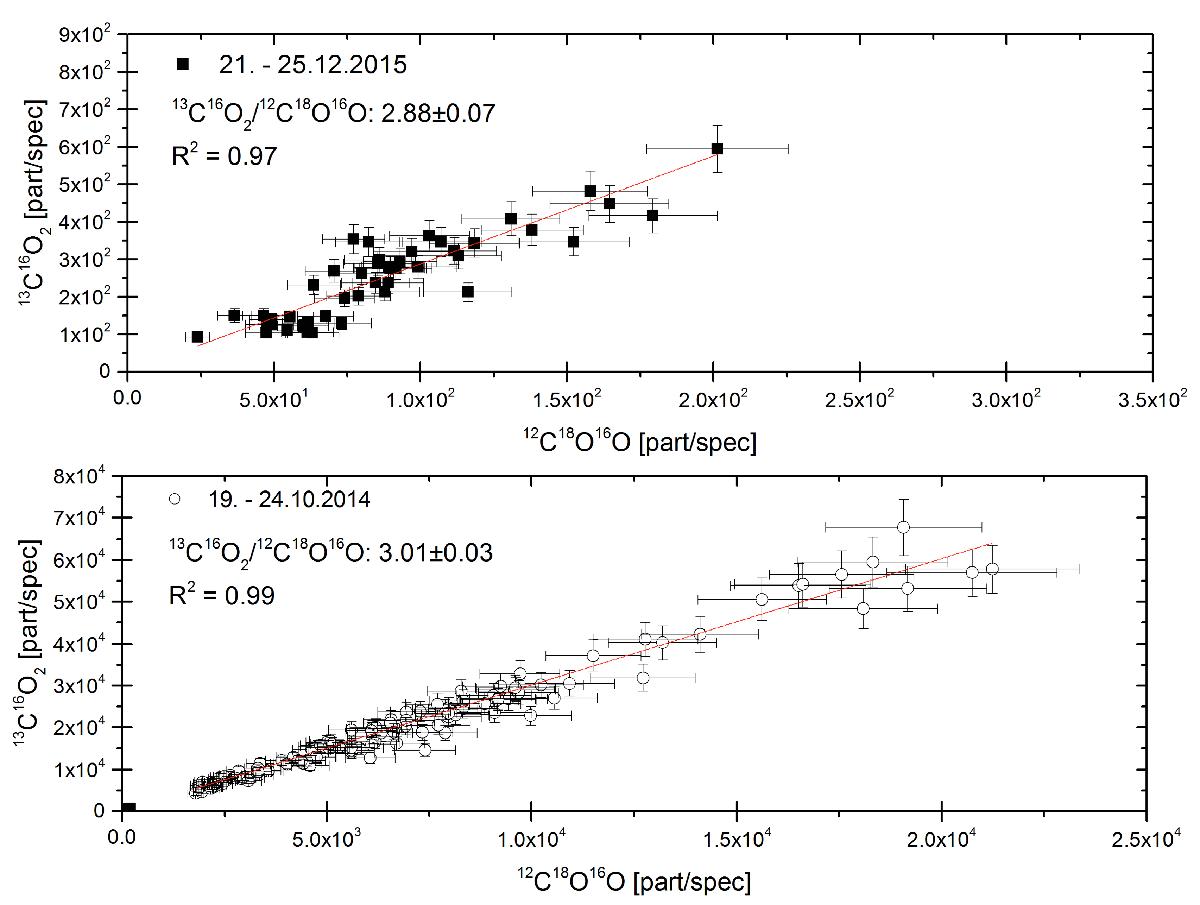
Signal for 13C16O2 versus 12C18O16O in the coma of 67P. The top panel black squares show the correlation of the signal for 21–25 December 2015. The bottom panel shows the data set of October 2014 (circles) and the measurements of December 2015 (the black squares in the left corner). Error bars show uncertainties of the single measurements. The red line is the least square linear fit.
Current usage metrics show cumulative count of Article Views (full-text article views including HTML views, PDF and ePub downloads, according to the available data) and Abstracts Views on Vision4Press platform.
Data correspond to usage on the plateform after 2015. The current usage metrics is available 48-96 hours after online publication and is updated daily on week days.
Initial download of the metrics may take a while.