Fig. 2
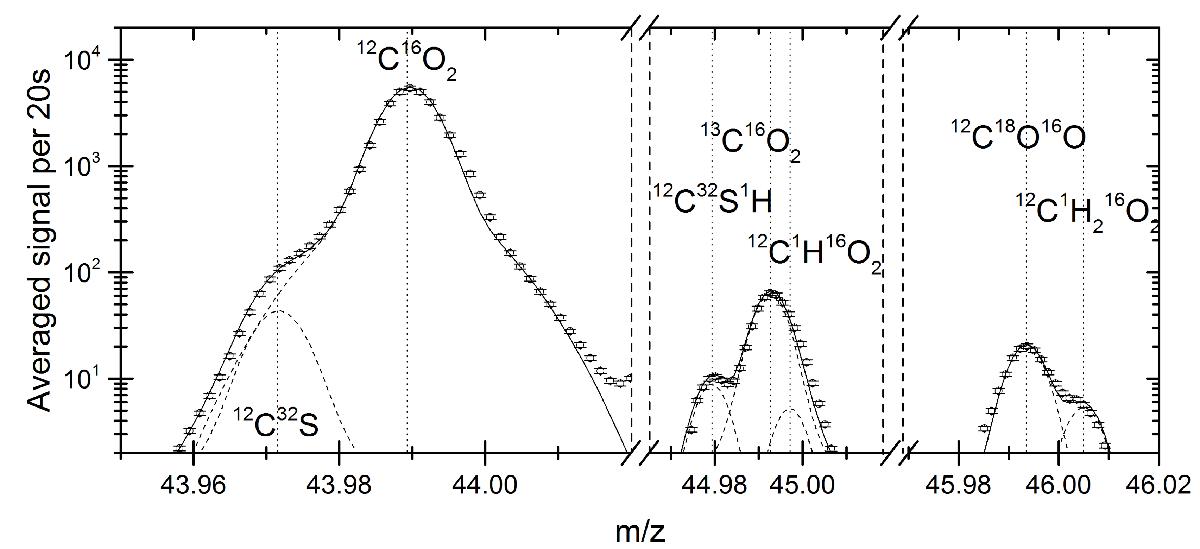
Measured signal averaged over 87 co-added 20s spectra and detected species on m/z 44 u/e, 45 u/e, and 46 u/e. The circles show the measured points on the detector, while the dashed lines are the fit of the according peak fits. The solid line represents the sum of all fits. Error bars represent the uncertainty due to counting statistics (![]() ).
).
Current usage metrics show cumulative count of Article Views (full-text article views including HTML views, PDF and ePub downloads, according to the available data) and Abstracts Views on Vision4Press platform.
Data correspond to usage on the plateform after 2015. The current usage metrics is available 48-96 hours after online publication and is updated daily on week days.
Initial download of the metrics may take a while.