Fig. 9
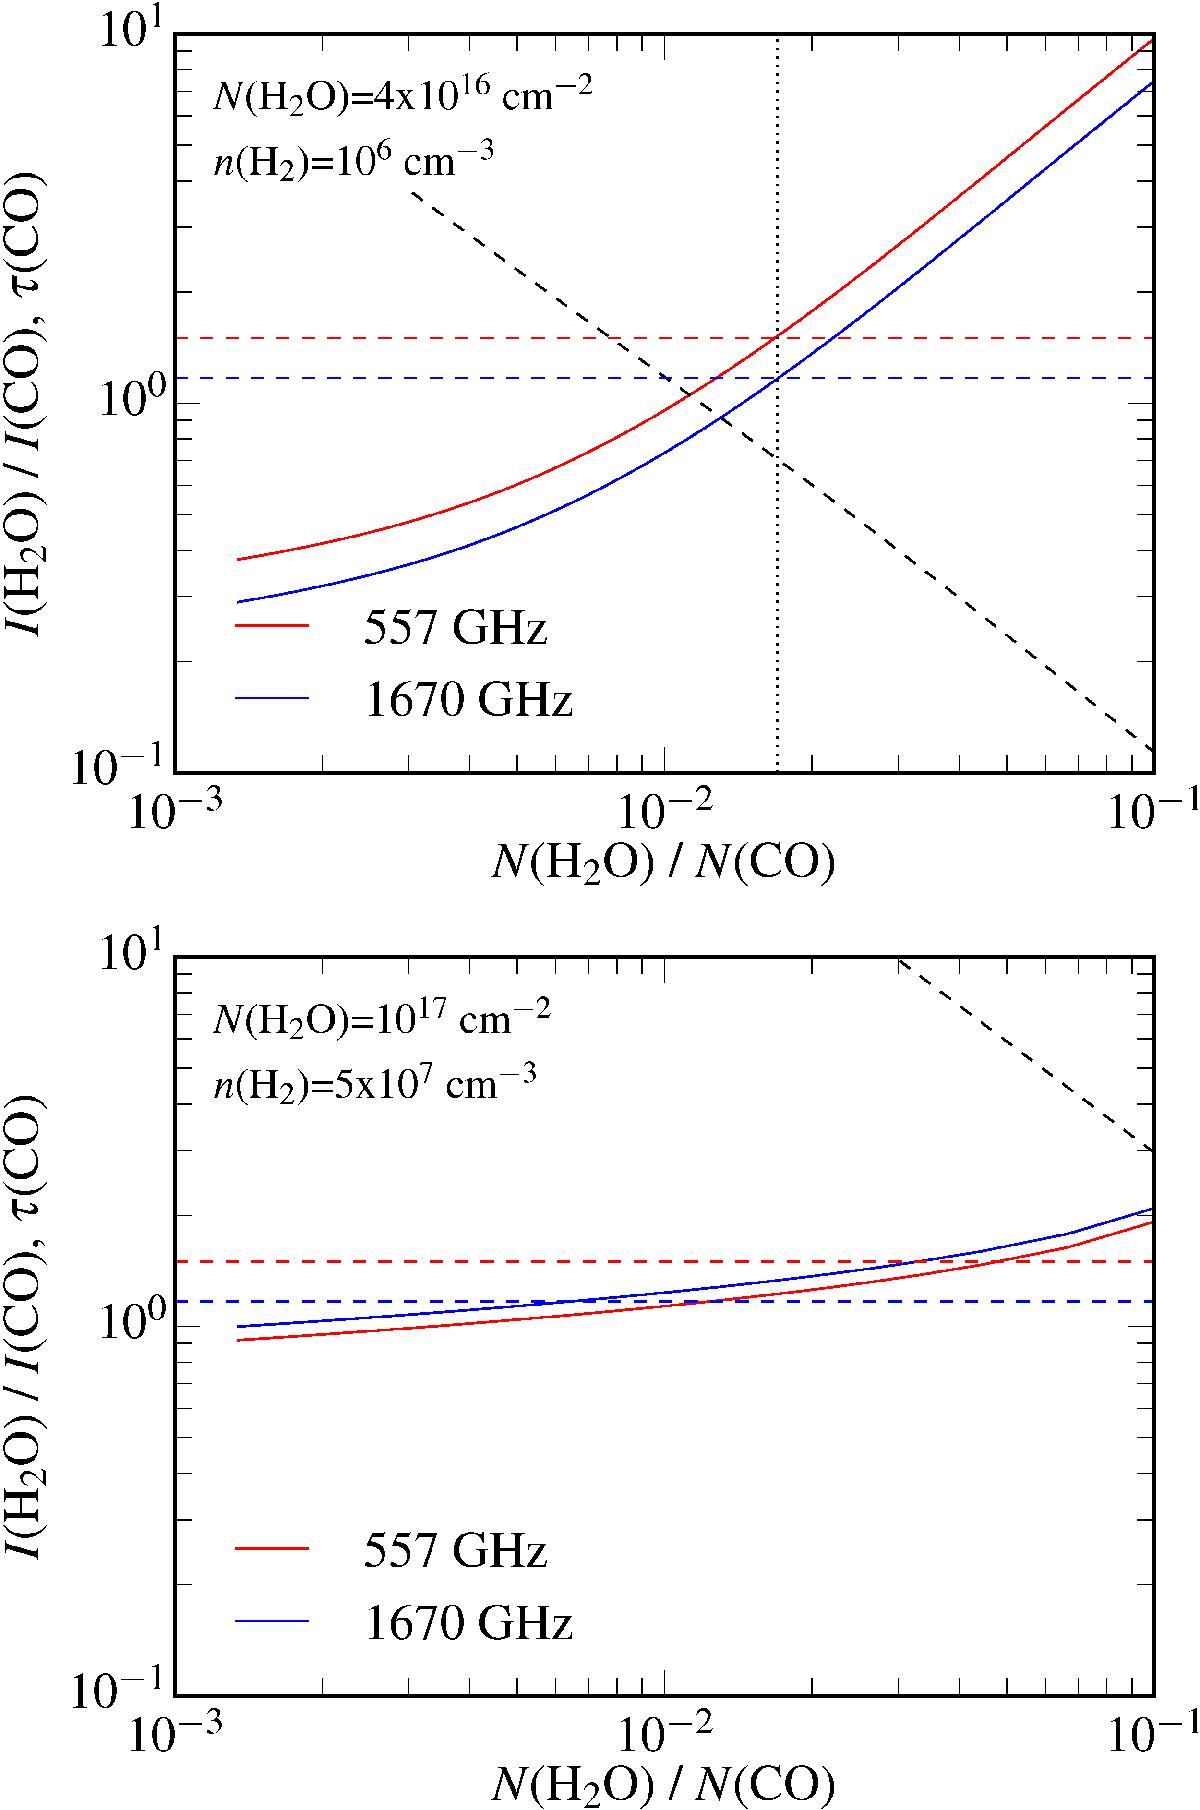
Modeled intensity ratio of the 557 and 1670 GHz H2O lines over CO 16–15 as a function of the H2O/CO column density ratio, where the H2O column density is both ortho- and para-H2O. The observed ratios are shown as dashed horizontal lines. The black dashed line is the CO 16–15 opacity, and is shown on the same scale as the intensity ratio. Top: subthermal excitation conditions for H2O. Bottom: thermal excitation conditions for H2O.
Current usage metrics show cumulative count of Article Views (full-text article views including HTML views, PDF and ePub downloads, according to the available data) and Abstracts Views on Vision4Press platform.
Data correspond to usage on the plateform after 2015. The current usage metrics is available 48-96 hours after online publication and is updated daily on week days.
Initial download of the metrics may take a while.