Fig. A.1
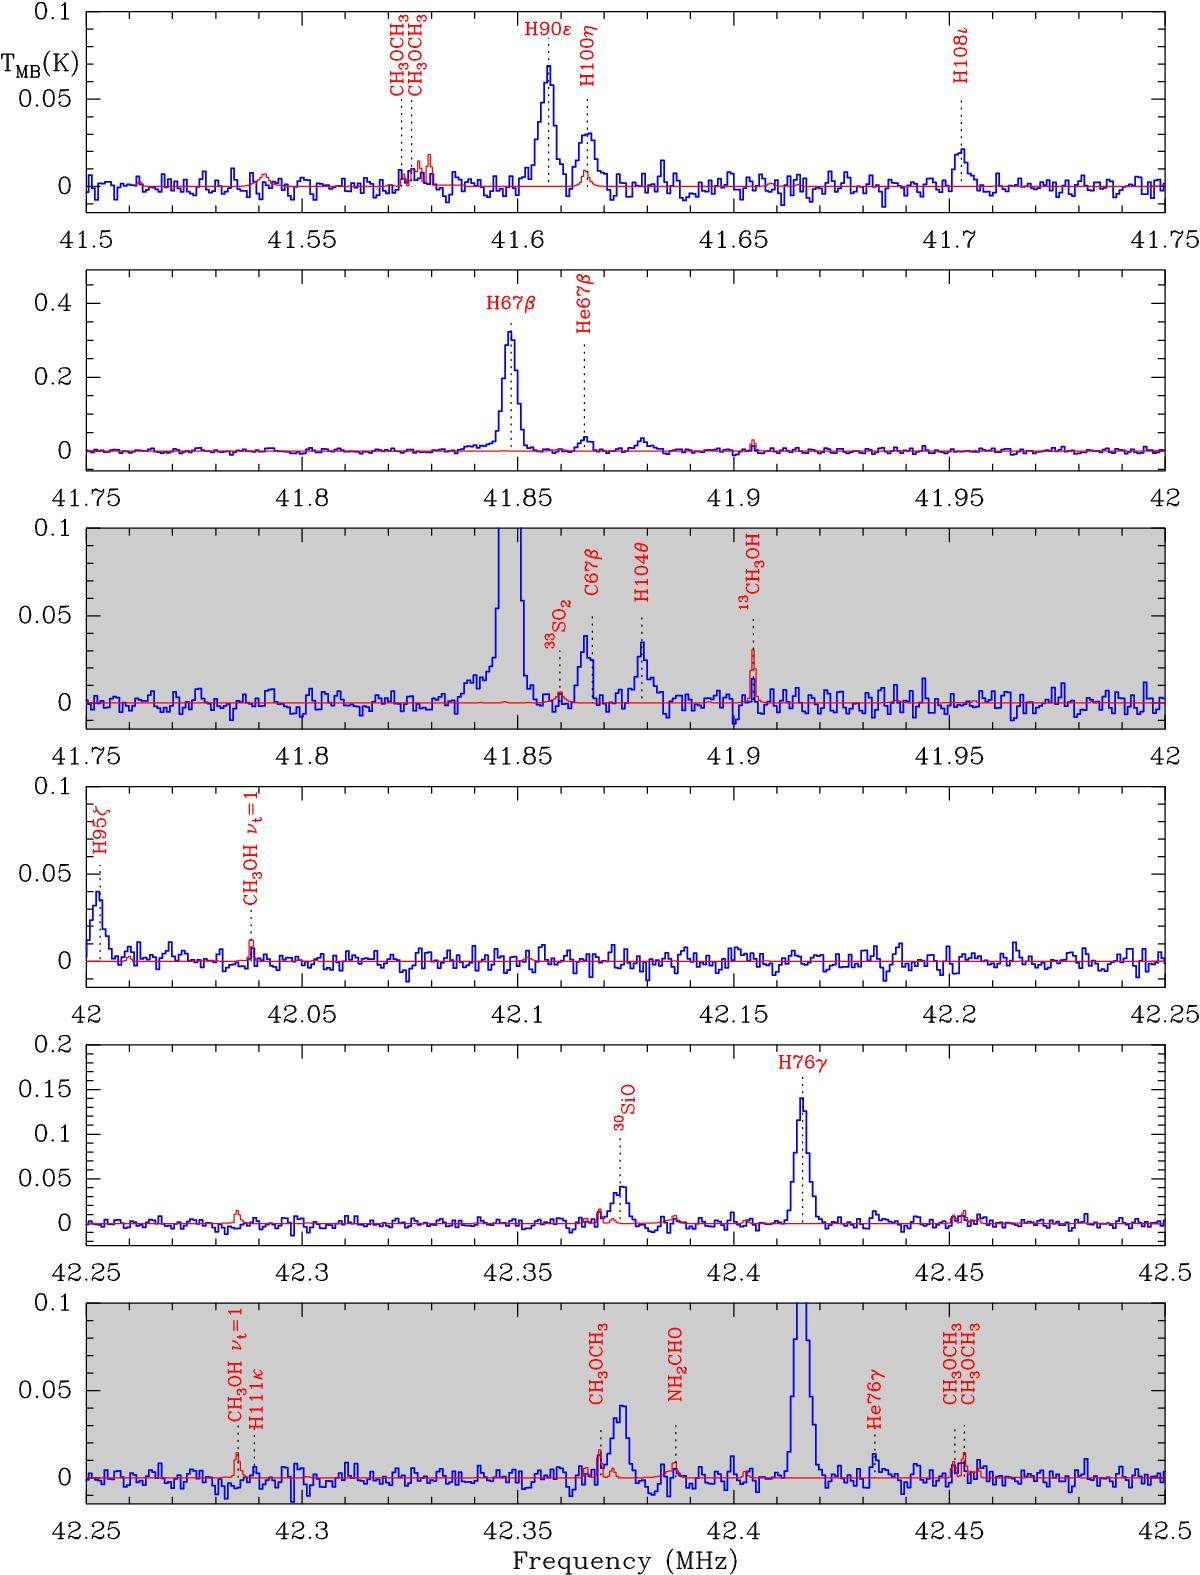
Detailed view of the observed spectrum of Orion KL at 7 mm (in blue), superimposed on the identification of the most intense lines and the best fit model for the molecular species (in red). Each panel displays a width of approximately 250 MHz. In order to improve the visibility of low intensity lines, some frequency ranges are plotted with a zoom in intensity (grey boxes); a second level of zoom, when necessary, is also depicted (yellow boxes). To compute the rest frequencies, a velocity of vLSR = +9 km s-1 is assumed. We note that the model results do not include the SiO masers nor the RRLs.
Current usage metrics show cumulative count of Article Views (full-text article views including HTML views, PDF and ePub downloads, according to the available data) and Abstracts Views on Vision4Press platform.
Data correspond to usage on the plateform after 2015. The current usage metrics is available 48-96 hours after online publication and is updated daily on week days.
Initial download of the metrics may take a while.