Fig. 24
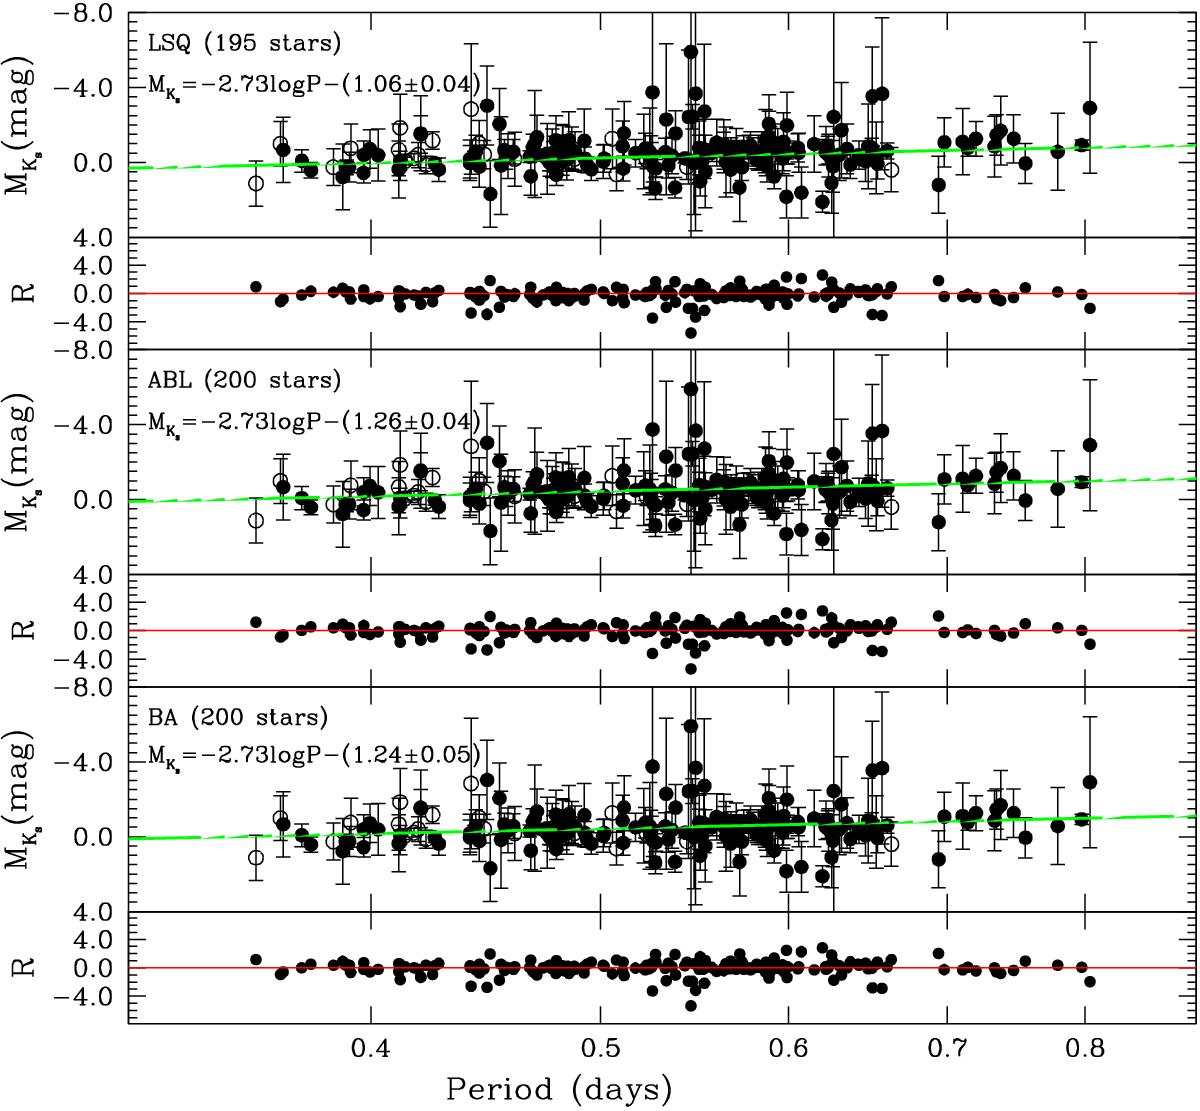
RR Lyrae PL relation in the Ks obtained i) via linear least-squares fits of the stars’ absolute magnitudes inferred from direct transformation of the TGAS parallaxes (upper panel); ii) via non-linear least-squares fits and the ABL method (middle panel); and iii) using the Bayesian approach (bottom panel). The slope of the fit is taken from Muraveva et al. (2015). Filled and empty circles represent fundamental-mode (RRab) and first overtone (RRc) stars, respectively. The bottom part of each panel shows the residuals from the best fit line.
Current usage metrics show cumulative count of Article Views (full-text article views including HTML views, PDF and ePub downloads, according to the available data) and Abstracts Views on Vision4Press platform.
Data correspond to usage on the plateform after 2015. The current usage metrics is available 48-96 hours after online publication and is updated daily on week days.
Initial download of the metrics may take a while.