| Issue |
A&A
Volume 605, September 2017
|
|
|---|---|---|
| Article Number | A11 | |
| Number of page(s) | 11 | |
| Section | Galactic structure, stellar clusters and populations | |
| DOI | https://doi.org/10.1051/0004-6361/201629457 | |
| Published online | 31 August 2017 | |
Using binary statistics in Taurus-Auriga to distinguish between brown dwarf formation processes
1 Clara-Fey Gymnasium Bonn, Rheinallee 5, 53173 Bonn, Germany
e-mail: This email address is being protected from spambots. You need JavaScript enabled to view it.
2 Centro de Astrobiología (INTA-CSIC), Carretera de Ajalvir km 4, 28550 Torrejón de Ardoz, Madrid, Spain
3 Instituto de Astrofísica de Canarias (IAC), Calle vía Láctea s/n, 38200 La Laguna, Tenerife, Spain
4 Universidad de La Laguna, Dpto. Astrofísica, 38206 La Laguna, Tenerife, Spain
5 Helmholtz-Institut für Kern- und Strahlenphysik, University of Bonn, 53113 Bonn, Germany
6 Charles University in Prague, Faculty of Mathematics and Physics, Astronomical Institute, V Holešovičkách 2, 180 00 Praha 8, Czech Republic
7 Steward Observatory, The University of Arizona, Tucson, AZ 85721, USA
Received: 2 August 2016
Accepted: 28 May 2017
Abstract
Context. One of the key questions of the star formation problem is whether brown dwarfs (BDs) form in the manner of stars directly from the gravitational collapse of a molecular cloud core (star-like) or whether BDs and some very low-mass stars (VLMSs) constitute a separate population that forms alongside stars comparable to the population of planets, for example through circumstellar disk (peripheral) fragmentation.
Aims. For young stars in Taurus-Auriga the binary fraction has been shown to be large with little dependence on primary mass above ≈ 0.2 M⊙, while for BDs the binary fraction is < 10%. Here we investigate a case in which BDs in Taurus formed dominantly, but not exclusively, through peripheral fragmentation, which naturally results in small binary fractions. The decline of the binary frequency in the transition region between star-like formation and peripheral formation is modelled.
Methods. We employed a dynamical population synthesis model in which stellar binary formation is universal with a large binary fraction close to unity. Peripheral objects form separately in circumstellar disks with a distinctive initial mass function (IMF), their own orbital parameter distributions for binaries, and small binary fractions, according to observations and expectations from smoothed particle hydrodynamics (SPH) and grid-based computations. A small amount of dynamical processing of the stellar component was accounted for as appropriate for the low-density Taurus-Auriga embedded clusters.
Results. The binary fraction declines strongly in the transition region between star-like and peripheral formation, exhibiting characteristic features. The location of these features and the steepness of this trend depend on the mass limits for star-like and peripheral formation. Such a trend might be unique to low density regions, such as Taurus, which host binary populations that are largely unprocessed dynamically in which the binary fraction is large for stars down to M-dwarfs and small for BDs.
Conclusions. The existence of a strong decline in the binary fraction – primary mass diagram will become verifiable in future surveys on BD and VLMS binarity in the Taurus-Auriga star-forming region. The binary fraction – primary mass diagram is a diagnostic of the (non-)continuity of star formation along the mass scale, the separateness of the stellar and BD populations, and the dominant formation channel for BDs and BD binaries in regions of low stellar density hosting dynamically unprocessed populations.
Key words: binaries: general / stars: late-type / stars: low-mass / brown dwarfs / stars: formation
© ESO, 2017
1. Introduction: Brown dwarf flavours
In the star-like formation scenario a pre-stellar core can condense out from a self-gravitating collapsing molecular cloud to form a star (André et al. 2014; Lomax et al. 2015) when it reaches the density- and temperature-dependent Jeans mass of the ambient medium (Larson 1998; Bate & Bonnell 2005; Bonnell et al. 2006; Klessen et al. 2007). Fragmentation of this kind can continue until a core becomes opaque to its own cooling radiation so that the Jeans mass cannot decrease further (Rees 1976; Low & Lynden-Bell 1976; Silk 1977). This is likely the dominant channel to build up the population of hydrogen-burning stars. In his review, Luhman (2012) summarized further mechanisms that have been proposed to produce brown dwarfs (BDs). In the scenario of gravitational compression and fragmentation, tidal shear and high velocities in a star-forming cluster prevent low-mass objects to continue accretion to reach stellar masses (Bonnell et al. 2008). Dynamical interactions among fragments or protostars in a massive core could lead to the ejection of some of these objects, which prematurely halts their accretion (Reipurth & Clarke 2001; Boss 2001; Bate et al. 2002, 2003; Goodwin et al. 2004; Umbreit et al. 2005; Bate 2011). Photoionizing radiation from massive OB stars might contribute by removing much of the envelope and disk of a low-mass protostar (Hester et al. 1996; Kroupa & Bouvier 2003a; Whitworth & Zinnecker 2004). Alternatively, turbulent compression and fragmentation of gas in a molecular cloud produces collapsing cores over a wide range of masses (Padoan & Nordlund 2002, 2004; Hennebelle & Chabrier 2008; Elmegreen 2011). Very low-mass stars (VLMSs) and BDs then arise from the smallest cores. Luhman (2012) concluded that VLMSs and BDs can form via the star-like formation mechanism without the need to invoke further formation channels.
In order to form a BD or BD-BD binary directly in the turbulent molecular cloud, a sufficiently high density is required for the proto-BD to be self-gravitating, but at the same time the proto-BD cloud core needs to have a very low mass. Such a combination of conditions seems increasingly unlikely with decreasing mass; this is why the theoretically calculated IMF decreases steeply below about 0.1 M⊙, which conflicts with observational results (Thies et al. 2015, and references therein). This suggests the need for additional formation channels to produce BDs.
Theory and simulations suggest that it is possible to form planets, BDs, and VLMSs through “peripheral fragmentation”, a term coined by Thies et al. (2015) to denote formation channels different from star-like formation, such as disk or filament fragmentation1. Stamatellos & Whitworth (2009) showed from their SPH computations using sink particles and a smoothing length to mimic realistic behaviour that massive disks arise frequently, but should be observed infrequently since a high proportion of BDs and VLMSs form rapidly within these objects through disk fragmentation. These become ejected or are pumped to large eccentricities by the mutual interaction between the multiple fragments that form in a single disk. Through the same mechanism BD-BD binaries form in their disks and might eventually be scattered into the field. These authors concluded that “disc fragmentation is a robust mechanism” and that it “can produce [...] most of the BD stars, and a significant proportion of the very low-mass hydrogen-burning stars”. Basu & Vorobyov (2012) improved and confirmed these previous results by self-consistent modelling of compact gaseous clumps, a gas disk, and the host star via a grid-based model. The authors concluded that clump ejection from the disk and, thus, the formation of isolated VLMSs and substellar objects is common. They preliminarily estimated that 1 in every 10 stars ejects an embryo. Such objects do not need to contract to stellar densities to be ejected into the intra-cluster medium. Basu & Vorobyov (2012) explicitly demonstrated that their ejection speeds are low and that they do not differ much from those of YSOs and should remain spatially co-located.
Forgan & Rice (2013) have devised a population synthesis model in which objects form through gravitational instabilities in the periphery of circumstellar disks and subsequent tidal downsizing. Brown dwarfs are the majority of objects that form in their models. Forgan et al. (2015) have built upon the latter model and have coupled it with an Nbody integrator to follow both the effect of fragment-fragment scattering and their dynamical evolution in clusters up to 10 Myr. They have demonstrated, among other results, that a large fraction of such objects become ejected from their disks and populate the cluster field as free-floating objects. Li et al. (2015) have followed a comparable approach by making use of the SPH models of Stamatellos & Whitworth (2009) and a Nbody technique. They have also found that most objects having formed through peripheral fragmentation (henceforth peripheral objects) escape from their host star and additionally investigate the orbital properties of BD-BD binaries formed through capture within the disk. They have found a separation distribution peaked between 5−10 AU (their Fig. 11) that is comparable to observations of the BD population in the Galactic field (Burgasser et al. 2007).
Taurus multiplicity surveys.
Recently, Lomax et al. (2016) have found that according to their SPH computations turbulent flows need to be strongly convergent and have comparable speeds to collapse and form a BD in isolation. Thus, they have considered it unlikely that a large number of observed isolated BDs have also formed in isolation. They have concluded that it is “difficult to envisage this being the only way, or even a major way, of forming isolated brown dwarfs”. Vorobyov (2016) have investigated ejection of gaseous clumps from protostellar disks via many-body interactions in a grid-based model, of which about half are self-bound after ejection. Their computations can lead to wide separation free-floating binary clumps in the BD mass range. All ejected clumps are true ejections rather than scattered objects since these have velocities greater than the escape speed from the central star.
From the above considerations it follows that (i) there exist two separate formation channels for free-floating BDs, namely that they can form both star-like and through peripheral fragmentation with subsequent dynamical evolution; and (ii) the formation modes cannot easily be distinguished.
Notwithstanding these theoretical findings, the case for a single star-like formation mode for both stars and BDs is often made in the literature. One argument put forward as apparent evidence in favour of a single formation process of stars and BDs is the continuously decreasing trend of binary fraction with decreasing primary mass in the Galactic field over and above the hydrogen-burning mass-limit (HBML; Duchêne & Kraus 2013; Reipurth et al. 2014, see Sect. 5 in this paper for a discussion of further arguments). However, one must be cautious in concluding that this is a general trend that is indicative of a single, continuous formation mode since the field population is pieced together from stars of many different ages (Marks & Kroupa 2011), where massive stars are on average significantly younger than solar-type and VLMSs. Figure 6 in Thies et al. (2015) shows how the addition of many cluster populations, which have dynamically processed their binaries internally, lead indeed to the same continuous trend crossing the HBML without steep gradients, although the binary fraction for stars was close to 100% initially, independent of primary mass (the theoretical population), and included separate populations for stars and BDs.
The trend of the binary fraction in coeval populations, i.e. in star clusters and star formation regions, is likely more informative. But also here the dynamical history needs to be properly accounted for before drawing conclusions. Accordingly, a preferably young region hosting a primordial population is a suitable test bed for investigating this primary-mass dependency.
We use the example of the Taurus-Auriga star formation region to address the questions of which channel dominates the BDs seen in the Galactic field, young clusters, and star-forming regions and how far up in mass peripheral fragmentation and how far down in mass star-like formation can occur, here. In particular we suggest a means to observationally distinguish between single or multiple formation modes of stars and BDs in this region. Taurus-Auriga is unique given its proximity, youth, and low density and, thus, has experienced little dynamical alteration of its binary population. The aim of the present study is to model the declining trend from the high binary fraction of stars to the small binary fractions for BDs in this region using separate formation modes and to predict observable features in future surveys of Taurus-Auriga type aggregates.
2. The stellar and substellar population in Taurus-Auriga
The Taurus star formation region has a distance of ≈ 140 pc (Kenyon et al. 1994; Wichmann et al. 1998; Torres et al. 2012) and extends over a region of 100 square degrees on the sky. The age of its population is ≈ 1 − 2 Myr, but Daemgen et al. (2015) found an additional co-moving sub-population of ≈ 20 Myr. Six distinct clusters of very young stars in Taurus were detected by Gomez et al. (1993) to have projected radii of 0.5 − 1 pc with ≈ 15 binaries each with a mass of about 6 M⊙ if the average stellar mass is ≈ 0.4 M⊙, and a median separation between the stellar centre-of-mass systems within each cluster of 0.3 pc. The individual groups are separated by a few pc, thus do not interact dynamically. All of Taurus has more than 300 known members and the stellar density in each of its groups is very low with 1−10 stars pc-3 (Luhman et al. 2009). The N-body models of Kroupa & Bouvier (2003b) show that Taurus-Auriga-like arrangements are largely unevolved and in particular that the binary properties should be similar to those at birth with some dynamical evolution (Marks & Kroupa 2011).
Taurus exhibits a paucity of high-mass young stars (Kenyon et al. 2008) and was originally proposed to be deficient in low-mass stars (Briceño et al. 2002) as well. Many BDs have however since been discovered (Luhman 2004; Guieu et al. 2006). Kroupa et al. (2003) and Thies & Kroupa (2008) show that there is no need to invoke a non-canonical initial mass function (IMF) in Taurus.
Todorov et al. (2014) searched for companions to young BDs in Taurus and Chamaeleon I. Resolving binaries with separations larger than 10 AU, by combining their results with the studies of Kraus et al. (2006), Konopacky et al. (2007), and Kraus & Hillenbrand (2012), they find a binary fraction of  % for M4−M6 type binaries (0.1 − 0.3 M⊙) and
  % for binaries in their sample with spectral type >M6 (< 0.1 M⊙) in Taurus. Given the youth and low density of Taurus, Todorov et al. (2014) have suggested that the observed reduction of binary fraction towards later spectral types might be primordial.
Among 45 observed T Tauri stars in Taurus, Ghez et al. (1993) found 22 binaries with angular separations between 16−252 AU. The binary fraction is thus ≈ 49 percent over this separation range. Simon et al. (1995) found 22 binaries and 4 triples among 47 systems. The binary frequency in the range 3 − 1400 AU is at least 1.6 ± 0.3 times the value of the canonical Galactic field sample (Duquennoy & Mayor 1991; Raghavan et al. 2010). Kraus & Hillenbrand (2009) found 27 wide binaries in Taurus in the separation range 500 − 5000 AU with masses down to ≈ 0.1 M⊙, which is consistent with a log-flat distribution but inconsistent with the Galactic field log-normal distribution. Leinert et al. (1993) and Kohler & Leinert (1998) identified in total 74 binaries or multiples among 174 systems. The binary fraction of 42.5 ± 4.9 percent is larger by a factor of 1.93 ± 0.26 than that of solar-type main sequence stars over the accessible separation range. In a high resolution imaging study Kraus et al. (2011) has found that 2 / 3 − 3 / 4 of all Taurus stars are multiple. In the most recent near-infrared imaging search for stellar and substellar companions, Daemgen et al. (2015) have targeted 64 Taurus members with masses between 0.2 and 3 M⊙, identifying secondaries down to 2 MJup. Within their 90% completeness limit these authors have found a raw multiplicity fraction of  in the separation range 10 − 1500 AU. After completeness correction for the full separation range they have found 62 ± 14% of all Taurus companions in the range 0.7 − 1.4 M⊙ to be multiple, which is comparable to Kraus et al. (2011) results. This corresponds to a ≈ 1σ detection for a 1.4 × larger binary fraction of solar-type stars in Taurus compared to the Galactic field (Raghavan et al. 2010). The frequency of proto-stellar binaries appears to be even larger still (Chen et al. 2013).
All surveys combined thus suggest the stellar binary fraction to be significantly larger in the Taurus-Auriga groups than in the field. We summarize the previously mentioned surveys in Table 1.
3. Modelling the (sub-)stellar single and binary population of Taurus
In contrast to the stellar population of Taurus, its BDs exhibit a small binary fraction (Todorov et al. 2014) and we assume that peripherally formed BDs have a field-like narrow orbital-parameter distribution. A small binary fraction as well as the narrow separation distribution for BDs also results from SPH models of peripheral fragmentation (see Introduction; e.g. Li et al. 2015). In turn, there is a strong decline in binary fraction from M-dwarfs to BDs, independent of the following model details. The aim here is not to present a final word, but instead to get an idea of how the binary fraction might shrink in this mass range and to predict features in its primary mass dependency if BDs and stars have their own IMFs and binary distribution functions.
3.1. Initial mass function
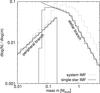 |
Fig. 1 Stellar and substellar IMF are disjoint in the present model (black histograms). The dotted lines indicate an underlying power law of the mass spectrum in the form dN/ dm ∝ m− α with α = 0.3,1.3, and 2.3 (from left to right). Objects from the peripheral branch of the IMF lying above the HBML (vertical dashed line) are stars forming in circumstellar disks and star-like BDs stem from the stellar branch of the IMF lying below the HBML. Both populations mix and form the system IMF (31% and ≈ 100% binary fraction for the BD and stellar branch, respectively; see Sect. 3.1). The discontinuity is thus hidden from an observer (grey histogram). Figure taken from Marks et al. (2015). |
In order to model Taurus’ (sub-)stellar population, in which BDs and BD binaries form dominantly through peripheral fragmentation and capture in the circumstellar disk, we invoke a combined IMF for BDs and stars that is discontinuous around the HBML but whose distinct branches overlap somewhat in mass (Fig. 1; see also Kroupa et al. 2013), 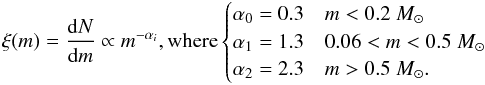 Upon combining both branches, their distinctness disappears in observations, strongly declining near the HBML instead for the model parameters chosen here. The parameters of the IMF in Fig. 1 have been obtained empirically by comparing the discontinuous model to observations but can vary somewhat from region to region (Thies & Kroupa 2007, 2008).
A sharp cut in mass between the two branches seems odd, since there is no reason why the star-like and peripheral formation mode should care about a common limit, so there is likely some overlap in mass for star-like BD formation and peripheral fragmentation. In the SPH computations of Stamatellos & Whitworth (2009) VLMSs form through peripheral fragmentation up to ≈ 0.2 M⊙. By comparing the present IMF model to observations of the IMF in Taurus, IC 348, the Pleiades and the Orion Nebula Cluster, Thies & Kroupa (2007, 2008) constrain the maximum mass for peripheral fragmentation to be close to this mass as well. In addition, Marks et al. (2015) require the same limit to model the late M-dwarf binary population in the Galactic field when using separate formation modes. Thus, these independent theoretical and empirical constraints suggest that the limit for peripheral fragmentation lies near 0.2 M⊙. The lower limit for star-like formation is here chosen to be 0.06 M⊙, which is a value close to but below the HBML to allow for some BDs to be formed star-like. Using this choice of mass limits reproduces constraints of Galactic field binary populations (Marks et al. 2015).
The discontinuity in the IMF depends on the fraction of peripheral objects to star-like objects in the population, ℛpop = Nperipheral/Nstar − like, and is chosen to be 0.3. This reflects the empirically determined value for Taurus-Auriga and the Pleiades (Thies & Kroupa 2007), i.e. for every three star-like bodies there is one object that is formed through peripheral fragmentation. For the parameters used here, 64% of all BDs in the range 0.01 − 0.08 M⊙ form in circumstellar disks while the remaining BDs form star-like (Thies et al. 2015). These numbers are sensitive to the chosen limits for star-like formation and peripheral fragmentation.
The IMF parameters should ideally be treated as free parameters, following Thies & Kroupa (2007, 2008) for individual regions. However, the aim here is not to constrain these parameters, but to model the decline of the binary fraction with decreasing primary mass, for which data are not yet fully available. While a wide range in mass of Taurus members is probed by existing studies (see Sect. 2), the individual analyses cover a limited separation range, which is restricted by the technique the respective teams used, and most studies do not extrapolate their binary fractions for the full separation range. Thus, it is not meaningful to plot the available data in a single diagram and infer a trend from it. Since the BD binary fraction is significantly smaller than the stellar binary fraction, varying the IMF parameters does not strongly influence the resulting features in the binary fraction – primary mass distribution; it only influences their location, as we qualitatively address in the discussion (Sect. 5).
3.2. Separation distribution
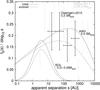 |
Fig. 2 Separation distribution for stars and BDs in the model (curves, Sect. 3.2) in comparison with observational data on stellar binarity in Taurus (symbols with |

3.2.1. Late-type stars and star-like brown dwarfs
The Daemgen et al. (2015) data are consistent with both a log-flat distribution suggested in previous multiplicity studies (Kraus et al. 2011) and the shape (not the multiplicity) of the solar-type separation distribution (Raghavan et al. 2010) in the accessible range of separations (≈ 10 − 1000 AU). The latter consistency might be due to the inclusion of a 10× older sub-population identified by Daemgen et al. (2015); this sub-population might have undergone more dynamical modifications than the 1 − 2 Myr old population, which likely resembles more closely the population at birth. But Kraus et al. (2011) also found that lower mass Taurus members (0.25 − 0.7 M⊙) show a paucity of binary companions with separation ≳ 200 AU, while solar-type stars and above do not. But this may as well be due to the lack of sensitivity to lower mass companions.
The universal2 birth binary population chosen here for all late-type stars and star-like BDs in Taurus is that of Kroupa (1995, his Eq. (8)), 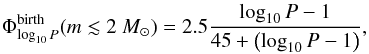 which has a maximum period log 10Pmax = 8.43, where P is measured in days, and a 100% initial binary fraction. The very long maximum birth orbital period is a formal solution and corresponds to a binary separation of about 0.03 pc for a system mass of 1 M⊙. This is the dimension of about a molecular cloud core and therefore constitutes a physically plausible case. Such systems will be easily torn apart through dynamical interactions in dense environments, but are required to match observations in young extended regions and star-forming regions. Comparably wide systems are observed in Taurus (Fig. 2).
This birth population is subjected to pre-main sequence eigenevolution, which is a process capturing the effects in the gas-embedded phase of proto-binary clumps, to yield the initial population. The initial population has not undergone any dynamical modification. Since the observed period distributions of G-, K-, and M-dwarfs are indistinguishable in shape, we assume that BDs selected from the star-like branch of the IMF, which formed through primary fragmentation in the same manner as stars, have the same initial distribution function as G-, K-, and M-dwarfs.
It may be argued that there are many different possible choices for the initial binary period distribution function. However, the distribution function derived by Kroupa (1995) was based on an iterative procedure, in which solutions were simultaneously sought to both the Galactic-field late-type distributions and to the pre-main sequence Taurus-Auriga constraints, and subject to stellar-dynamical modifications of these distribution functions that were taken care of using state-of-the-art Nbody computations. Consistency with the observed distribution of specific angular momenta in pre-stellar cloud cores was sought as well. Later work also demonstrated consistency with the binary populations in the dynamically evolved Orion Nebula cluster and the Pleiades cluster (Kroupa et al. 2001; Marks & Kroupa 2012; Marks et al. 2014), in the Galactic field (Marks & Kroupa 2011; Marks et al. 2015), and with trends of binary fraction in present-day globular clusters (Leigh et al. 2015).
As we can see from Fig. 2, both the Kraus et al. (2011) and Daemgen et al. (2015) data are compatible with this initial population. To account for the older sub-population we allow for some dynamical modification of the initial population over 5 Myr by placing it inside a typical Taurus-like sub-cluster, applying an analytical description of dynamical processing of binary populations in young star clusters.
Since the binding energy of a binary is supposedly key to whether a binary can be dissolved by dynamical interactions, Marks et al. (2011) have devised a time-dependent stellar-dynamical operator,  , which acts on the initial binding-energy distribution, Φlog 10Eb,in, of primordial binaries that results from initial separation distribution by Kroupa (1995) and random pairing of masses from the IMF. This operator modifies the original binding-energy distribution to a dynamically evolved distribution,
  from which other processed distributions, such as the separation and mass-ratio distribution, can be extracted via a Monte Carlo method. In this formulation,
  is the time-dependent binary fraction, fb = Nb/Ncms, i.e. the number of binaries per targets (“centre-of-mass” objects) normalized to the log-width of the binned distribution. A similar definition holds for the separation distribution in Fig. 3. The parameters describing the stellar-dynamical operator are found by following the evolution of binary populations in Nbody computations of clusters of different initial embedded stellar mass, Mecl, radius, r, and, thus, density. Marks et al. (2011) have found that the initially binary-dominated population changes on a crossing timescale, i.e. the resulting distributions after a few Myr depends only on the initial stellar density, the population should not be strongly altered beyond that time.
Upon applying the operator for a moderate initial density (350 M⊙ pc-3; see Marks & Kroupa 2012) on the initial distributions for Taurus’ age of ≈ 1 Myr, we see that the agreement with the Daemgen et al. (2015) data persists for the processed initial population.
3.2.2. Peripheral objects
Each BD binary and VLM M-dwarf binary selected from the peripheral branch is assigned a semi-major axis selected from the observed narrow separation distribution of BDs in the Galactic field. The used Gaussian distribution has a width σ = 0.4 (in log 10 AU units) with a peak at log 10s/ AU = 0.66 (according to Thies & Kroupa 2007, using the data from the Very Low Mass Binary Archive). Most of the selected objects remain single, however, to meet Galactic field constraints upon combining them with star-like BDs. Marks et al. (2015) empirically determine the total binary fraction for binaries on the IMF peripheral branch to be ≈ 31%, assuming the Galactic field BD population has been largely unaffected by dynamical processing in their progenitor embedded clusters.
We expect this to be largely the case because if BD binaries form dominantly through peripheral fragmentation there is a natural truncation of the separation distribution at large separations due to the extent of circumstellar disks of ≲few hundred AU. This leaves BD binaries with separations that are not strongly affected by dynamical processing in host clusters they were born in, at least up to moderate initial densities. The fraction of BD binaries in the separation distribution can decrease nevertheless due to dynamical disruptions of BD binaries and stellar binaries with a BD companion originating from the star-like branch, as this adds single BDs (dashed BD distribution in Fig. 2).
4. Results: Primary-mass dependent binary fraction in between the mass limits for star-like and peripheral formation
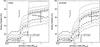 |
Fig. 3 Prediction of the primary-mass dependent binary fraction in dependence of resolution limit, if peripheral fragmentation applies (the discontinuous IMF model in Fig. 1). Left: binary fraction as a function of primary mass for the initial binary population with no dynamical evolution is plotted (Sect. 3.2). The different curves denote the trend for varying survey resolution limits; binaries with separations larger than 0, 1, 3, 5, 7, 10, 50, 100, and 200 AU (top to bottom) are resolved. Binaries with separations smaller than the respective resolution limits are counted as single in the model. The solid cross denotes the Daemgen et al. (2015) estimation that 62 ± 14% of solar-type Taurus members over the full separation range are multiples, in concordance with Kraus et al. (2011) finding that about 2/3−3/4 of their targets in Taurus are binaries or higher order multiples. The dashed crosses are data from Todorov et al. (2014) who resolve separations a> 10 AU. Right: same as left panel but with dynamical evolution in the Taurus-Auriga groups added (see Sect. 3.2). |
Daemgen et al. (2015) find that the binary fraction of young Taurus members shows no correlation with mass in the range 0.2 − 3 M⊙, contrasting the older subpopulation for which they find ≈ 3σ evidence for a declining trend with decreasing primary mass. If these observations do not have a primordial origin, the age dependency might suggest that stellar dynamical processes are at work. Combining both populations results in a weak ≈ 1σ trend. Daemgen et al. (2015) show their results for Taurus to compare well with earlier results obtained for Upper Sco (Lafrenière et al. 2014).
In Fig. 3 (left panel) the trend of binary fraction as a function of primary mass in the model predicts the same absence of a trend for young stars in Taurus if dynamical evolution has no strong impact. Furthermore the binary fraction for stars should decline weakly, at best, towards lower masses until peripheral objects enter the binary statistics (here below 0.2 M⊙; cf. Fig. 1); the binary fraction strongly declines because of the sudden presence of many single objects having formed peripherally in circumstellar disks. Another dip occurs when the star-like formation mode ceases to exist (here at 0.06 M⊙; cf. Fig. 1) and peripheral fragmentation is the only remaining formation channel available to BDs and planets below that mass. The right panel of Fig. 3 shows the same, but with dynamical modification of the initial population in a small Taurus-like cluster with an initial density of 350 M⊙/pc3 (Marks & Kroupa 2012). The overall binary fraction has dropped a little due to the break-up of binaries. A weak correlation of binary fraction with increasing primary mass shows up as well for hydrogen-burning stars since lower mass binaries have on average a lower binding energy and are more susceptible to dissolution. This trend is qualitatively consistent with the results of Daemgen et al. (2015) as well. The features occurring at the depicted mass limits for star-like formation and peripheral fragmentation are otherwise similar. The observed binary fraction depends on the resolution limit of the survey.
The observational constraints on the binary fraction by Todorov et al. (2014) and Daemgen et al. (2015) agree somewhat better with the models that allow for dynamical processing of the binary population in Taurus. In particular the Todorov et al. (2014) survey data, which resolved binaries with semi-major axes > 10 AU, is consistent with the curve representing the model with a resolution limit > 10 AU.
The inclusion of other observational studies in Fig. 3, as discussed in Sect. 2, is not reasonable since a relatively limited separation range is covered in comparison. Instead we compare the observationally inferred binary fractions to the model by subjecting the model to the separation and mass constraints of the Taurus surveys listed in Table 1. The model yields very good agreement to within the observational errors (Col. 3 versus 4) for the T Tauri surveys and for VLMSs. For higher mass stars in Taurus the model binary fractions lie inside 2× the observational error bars. In terms of binary fractions the model is thus overall consistent with the available surveys.
For the separation range 0 − 3 AU, currently no observation is available. To be tested against future observations, our model predicts (see Table 1) a binary fraction lying near ≈ 10 per cent for BD binaries in the mass range 0.01 − 0.1 M⊙ within this separation range, and 18 − 19 per cent for binaries with a stellar primary in the mass-range 0.1 − 2.0 M⊙, both for T Tauri stars and for the older subpopulation of Taurus.
5. Discussion
5.1. Distinguishing brown dwarf flavours in Taurus-Auriga
The present analysis has demonstrated how the large binary fraction for stars in Taurus-Auriga is expected to decline steeply from M-dwarfs towards BDs if stars form during the collapse of a proto-stellar cloud and BDs form preferentially, but not exclusively, through peripheral fragmentation in circumstellar disks. From our modelling we do not expect a rather smooth decrease as might be inferred from the available observational data alone. The strong decline in a relatively small mass range determined by the mass limits for peripheral and star-like formation is equally consistent with available data.
The characteristic features in Fig. 3 depend on the mass limits for star-like and peripheral formation. Mass limits lying further apart might flatten the trend in between these limits, while close by mass limits would pronounce the decline. A decline near these mass limits with a “saddle” in between, where stellar and peripheral branch overlap, is characteristic in either case. While the upper mass limit for peripheral formation of 0.2 M⊙ is constrained by different studies (see Sect. 3.1) and expected to lie close to this value in Taurus, the lower mass limit for star-like formation is rather arbitrarily chosen here. Incoming observational data will help to better constrain the values for mmin,star − like and mmax,peripheral in Taurus-Auriga, if these mass limits are considered free parameters.
While the characteristic trend shown in Fig. 3 is specific to the present model, the general decline seen here for Taurus-Auriga-like groupings should be independent of the model details. That is the case if BDs alone form dominantly through peripheral fragmentation; i.e. they have a formation channel of their own that produces BD binaries much less frequent than the star-like formation mode and the stellar population has been unaffected by dynamical processing of its binary population. Further observables discussed here such as the separation distribution are model specific and can test the idea that the BD separation distribution is different from that for stars.
If the behaviour we predict here for the primary-mass dependent binary fraction near the HBML were confirmed in future observations, this would then be evidence for peripheral fragmentation to be dominant for BD production in Taurus-Auriga and possibly in other regions of low stellar surface density as well. That is, if other hitherto unknown scenarios in which BD binaries form star-like and have a small binary fraction can be excluded. We are not aware of a mechanism that would cause a similar decline in the binary fraction. Qualitatively, the existence of a critical angular momentum below which binary formation is hindered could be an option. Machida et al. (2008) demonstrate via MHD nested grid simulations that fragmentation in a collapsing cloud is controlled by the initial ratio of the rotational and magnetic energy, where rotation promotes and magnetic fields hinder fragmentation. If this were the mechanism to produce BD binaries much less frequently than stellar binaries, it remains qualitatively unclear why fragmentation into binaries suddenly becomes much less efficient close to the HMBL.
5.2. Dense star formation regions
In denser regions disks might be quickly disrupted owing to tidal interactions. The frequency of disks around stars is found to decrease with age (Haisch et al. 2001; Muzerolle et al. 2010; Hernández et al. 2008; Mamajek 2009), as is consistent with a dynamical reduction and questions about whether peripheral fragmentation can be dominant in dense environments. Thus, generalizing a positive result for Taurus-Auriga to regions of higher stellar density would, in this scenario, be possible only if the frequency of disk fragmentation (which may depend on the mass infall rate onto the disk, thermal physics in the disk, etc.) is larger than the frequency of disk-destructive encounters. On the other hand, the increased rate of stellar encounters may also lead to more triggered BD formation (Thies et al. 2005).
Pfalzner et al. (2014) caution that disk lifetimes might be considerably longer than inferred from a disk frequency–age trend since the above observational studies are biased towards the innermost parts of (formerly denser) clusters, while the outskirts of clusters or those systems that nowadays populate the Galactic field might have been exposed to very different, less destructive conditions3.
For the above reasons, peripheral fragmentation might still have been the dominant channel in regions of higher stellar density and, thus, for the BD population that nowadays exists in the Galactic field.
5.3. Ambiguity of observational tracers of continuous star formation
According to theory (Sect. 1), BDs can likely form both star-like and through peripheral fragmentation. However, the community favours continuous star formation along the mass scale, i.e. a single formation mode to explain their observations. In the following we discuss tracers that are frequently said to favour a common, single formation mode for stars and BDs.
5.3.1. Continuity of the initial mass function at the very low-mass star – brown dwarf transition
Kirk & Myers (2012) see a decline in the number of objects per log (M/M⊙) at about 0.1 in the differential mass distribution of the nearby star-forming regions Taurus, Lupus 3, Cha I, and IC 348, which persists for stars both in regions of high and low stellar density (their Fig. 12). In others, such as the σ Orionis open cluster (Bihain et al. 2009; Caballero et al. 2007; Lodieu et al. 2009; Peña Ramírez et al. 2012) and the Pleiades (Bihain et al. 2006; Zapatero Osorio et al. 2014), a decline is not obvious near the HBML. All mass distributions appear to show a continuous transition from BDs to stars, albeit exhibiting different gradients. We ask whether this is evidence for continuity in the star formation process.
Thies & Kroupa (2007) show that a proper treatment of BD multiplicity properties and unresolved binarity among stars reveals a discontinuity in observed continuous mass distributions, which, in contrast, indicates separate formation modes. The discontinuity remains pronounced when larger binary fractions among BDs are allowed for (Thies & Kroupa 2008). A recent analysis by Thies et al. (2015) furthermore shows that analytical theoretical derivations of the IMF, which assume BDs to be a continuous extension to stars, underestimate the numbers of observed BDs and thus require a correction term to account for the BD population, which is again interpreted to favour different formation channels.
Thus, whether or not a mass distribution seems to be continuous observationally, and whether it declines (strongly) near the HBML or not, the mass distribution can be modelled with a distinct BD and stellar branch of the IMF and is thus not an unambigious tracer of star-like formation.
5.3.2. Spatial distributions and velocities of VLMSs and BDs in very young open clusters
A similar spatial distribution for stars and BDs is observed in σ Orionis (Caballero 2008; Lodieu et al. 2009), ρ Ophiuchus (Parker et al. 2012), and the 25 Orionis group (Downes et al. 2014). Such observations are interpreted as indicative of a single formation mode.
However, SPH computations of peripherally formed BDs show that depending on whether already completely formed BDs or their gaseous progenitors are ejected or scattered, they can reach different escape speeds from their disks. As already discussed in Sect. 1, the hybrid grid-based model of Basu & Vorobyov (2012) demonstrated that ejection speeds of peripherally formed objects in their computations are low and that they do not differ significantly from the relative velocities of young stellar objects. In turn, BDs and stars should remain spatially co-located within their scenario, that is if later mass segregation through cluster dynamical evolution is either unimportant or the cluster is sufficiently young. That implies that co-location is not a conclusive indicator of a single formation mode for both stars and BDs.
5.3.3. Molecular outflows, accretion disks, and disk frequencies around (isolated) BDs
It is often argued that observations of outflows, BD disks, and their high disk frequencies demonstrate that substellar objects form as a simple continuation of the stellar process.
The faint object SMM2E will most likely remain a substellar object (30 − 35 MJupiter; Palau et al. 2014), as will a 73 MJupiter object in Taurus (Phan-Bao et al. 2014). These authors interpret their respective objects to be a scaled-down version of a forming star. Even the free-floating planetary mass object OTS44 (12 MJupiter) is interpreted to form star-like based on the existence of a substantial disk and significant accretion (Joergens et al. 2015).
Disks around VLMSs and BDs are observed to be more frequent than around higher mass stars in σ Orionis (Luhman et al. 2008b; Peña Ramírez et al. 2012), λ Orionis (Bayo et al. 2012), the Upper Scorpius association (Luhman & Mamajek 2012; Lodieu 2013), and the nearby young cluster NGC 1333 (Scholz et al. 2012). The opposite trend is seen in Chamaeleon I (Luhman et al. 2008a, 2010).
As disks around later type stars are exposed to a less destructive radiation field, the authors of the above studies ascribe their findings to different disk lifetimes for different stellar masses, indicating a continuous transition from stars to BDs. This finding is equally consistent with higher mass stars losing their disks much quicker than lower mass stars through gravitational interactions in higher density clusters (Pfalzner et al. 2006). In this scenario, the disk fractions of stars would have been higher in the past, perhaps even overhauling the disk fractions of BDs.
However, if BDs (or isolated planets) form in the disks of proto-stars through either encounter-triggered perturbations (Thies et al. 2010) or gravitational instabilities (Stamatellos & Whitworth 2009; Basu & Vorobyov 2012; Forgan & Rice 2013) and are nudged out or ejected, the resultant free-floating objects carry with them their own mass reservoir. Using their SPH computations, this has explicitly been shown by Stamatellos & Whitworth (2009) and Thies et al. (2015). As a result, all available models of BD formation are consistent with the detection of BD disks, a conclusion that is shared by Luhman (2012). In turn, observations of isolated BDs and massive planets carrying their own mass reservoir, having outflows, and exhibiting a large disk frequency among them is not evidence in favour of or against a particular formation mode.
Recently, Ricci et al. (2014) have observed extended disks towards three BDs (> 70 AU), which are not easily reconciled in a pure peripheral fragmentation scenario according to which BD disk sizes are limited to < 20 AU (Bate 2009, 2012). If true, this does not exclude the IMF model presented here, which has separate branches for peripheral and star-like objects. Thus, star-like BDs, which may have more extended disks, are possible in our model. On the other hand, the work by Bate (2009, 2012) is confronted by the study of Vorobyov (2016) suggesting extended disks exist for (at least some) ejected proto-BDs because the ejected clumps often possess high angular momentum.
5.3.4. Width of the separation distributions of Galactic field binaries
The binary fraction and width of the observed log-normal separation distributions in the Galactic field decline continuously with decreasing mass of the primary component (Duquennoy & Mayor 1991; Fischer & Marcy 1992; Delfosse et al. 2004; Bergfors et al. 2010; Raghavan et al. 2010; Janson et al. 2012; Jódar et al. 2013; Tokovinin 2014; Duchêne & Kraus 2013; Reipurth et al. 2014; Ward-Duong et al. 2015; Cortés-Contreras et al. 2017). This continuity across the mass limit between stars and BDs was apparently supported by recent investigations of the late M-dwarf binary population in the Galactic field. In a lucky-imaging survey, the AstraLux survey for earlier (Janson et al. 2012) and later (Janson et al. 2014) M-dwarfs (the two studies overlap somewhat in mass) showed separation distributions significantly narrower than those for solar-type stars, confirming results from a previous lucky-imaging survey (Bergfors et al. 2010). For the late M-dwarfs the separation distribution lies remarkably close to that for BDs in the Galactic field, suggesting a common origin. The conclusion that the distribution for M-dwarfs in the lucky imaging results is indeed that narrow originates from the observation that the distribution starts to decline strongly far from the resolution limit of the respective surveys.
This apparent continuity might however be the result of the density-dependent dynamical alteration of an environment-independent birth binary population for late-type stars in young star-forming regions (Kroupa 1995, 2011; Kroupa & Petr-Gotzens 2011; Marks & Kroupa 2012; Marks et al. 2014) and the subsequent addition of many such populations originating from different environments that comprise the Galactic field (Parker et al. 2009; Goodwin 2010; Marks & Kroupa 2011; Marks et al. 2015). In particular, the mutual proximity of BD and late-M separation distributions in Janson et al. (2014) might be following from separate BD and stellar populations that underwent dynamical processing, as Marks et al. (2015) have demonstrated. As for the early M-dwarf data, Marks et al. (2015) have pointed out that the lucky-imaging results potentially conflict with the M-dwarfs in Multiples (MinMs; Ward-Duong et al. 2015) data, which cover a comparable spectral-type range; but these authors have found a separation distribution for early M-dwarfs that has approximately twice the width inferred from the surveys of Bergfors et al. (2010) and Janson et al. (2012). A wider distribution would be in line with the distributions found by other previous studies (Fischer & Marcy 1992; Delfosse et al. 2004).
The notion of continuous star formation over and above the HBML from present Galactic field data could thus be a result of dynamical processing in the host clusters from which the field population originated, hiding any underlying separate (primordial) binary populations for stars and BDs. Observations noting the shrinking width of separation distributions in the Galactic field (but in star formation regions as well) cannot be explained unequivocally via a continuous star formation process.
5.4. Distinguishing brown dwarf flavours elsewhere
Along with our suggestion here to probe BD formation in Taurus-Auriga, three other recent studies have tried to shed light on how to decide whether star-like or peripheral formation is dominant in producing BDs.
-
1.
Stamatellos & Herczeg (2015) have suggestedthat for peripheral objects there is no (significant) correlationbetween the mass of the object and their disks or the accretion ratesfrom the disk onto it. This would deviate from a suggested lineardisk mass – stellar mass dependence and correspondingaccretion rates onto star-like formed objects derived for masses≳ 0.2 M⊙ (with considerable scatter though, Mohanty et al. 2013; Andrews et al. 2013) and is thus a potential diagnostic to distinguish different BD formation modes.
-
2.
Marks et al. (2015) have argued that a separate peripheral population might unmask itself through a peak on top of a wider separation distribution for late M-dwarfs (≲ 0.2 M⊙) in dynamically processed populations if some VLMSs form through peripheral fragmentation with Galactic field BD properties.
-
3.
While the hitherto mentioned observables focus on the properties of populations of BDs to distinguish formation channels, they cannot decide whether an individual (isolated) BD formed peripherally or star-like. Vorobyov (2016) have suggested a potential means to decide the formation mode on an object-by-object basis. From his grid-based computations the internal structure of ejected, thus free-floating, gaseous pre-BD clumps might be different from those formed through molecular cloud fragmentation. The former are more centrally condensed and have a higher central temperature than pressure-supported, gravitationally contracting spheres. Also, the rotational velocity of ejected clumps has a bi-modal distribution since they are often rotationally supported, making them very distinct from the rotational pattern of star-like forming objects.
6. Summary
The question investigated here is how to distinguish whether BDs form dominantly via peripheral fragmentation in circumstellar disks or star-like in Taurus-Auriga. We have argued that both formation channels are possible according to theory (see Sect. 1), which is why our models allow for both star-like and periphal formation of BDs. Peripheral formation is allowed down to 0.06 M⊙ and star-like formed BDs are allowed to range up to 0.2 M⊙ for various reasons (see Sect. 3.1), i.e. both channels overlap somewhat in mass.
We find that the binary fraction as a function of primary mass in Taurus-Auriga is expected to decline steeply in a narrow mass range between the mass limits for the star-like and peripheral mode according to our models with separate formation channels. This trend exhibits characteristic features in dependence of these limits (see Fig. 3 and Sect. 4). If observed in future surveys this could be interpreted as evidence that peripheral fragmentation is dominant for BD production in Taurus-Auriga. Such a trend might be unique to low stellar surface brightness (low density) regions hosting dynamically largely unprocessed populations.
Our models predict a binary fraction of ≈ 10 per cent and 18 − 19 per cent for primary masses in the range 0.01 − 0.1 M⊙ and 0.1 − 2.0 M⊙, respectively, for binaries with separations < 3 AU. Since no observation for this separation range is currently available, these numbers can be tested against future observations as well.
Peripheral fragmentation produces critical constraints matched by observations, for example the shape of the IMF around the HBML (Thies & Kroupa 2007, 2008; Thies et al. 2015); the binary statistics of BDs, which are different from higher mass stars (Thies & Kroupa 2008; Dieterich et al. 2012, Sect. 5.3.4); the generation of free-floating planetary mass objects and BDs (Stamatellos & Whitworth 2009; Li et al. 2015; Forgan et al. 2015; Vorobyov 2016); and the lack of BD companions to solar-type stars at low separations, which is known as the BD desert (Marcy & Butler 2000; Grether & Lineweaver 2006; Dieterich et al. 2012; Evans et al. 2012; Wilson et al. 2016). All these observables are expected from peripheral fragmentation models and are thus not unambigious tracers of a single star-formation mode (see Sect. 5.3). Instead, we put forward further potential actual tracers of BD formation in Sect. 5.4.
In conclusion, probing the binary population observationally in the transition region between star-like and peripheral formation (≈ 0.05 − 0.3 M⊙) in Taurus and other low stellar surface brightness star-forming regions might be a valuable effort to come closer to answering questions about the (non-)continuity of star formation across the VLMS/BD mass-range, the separateness of the stellar and BD populations and the dominant formation channel for BDs and BD binaries. It is important, however, that our information is not too restricted by separation ranges, so that surveys covering different mass ranges become directly comparable at best, i.e. by combining various methods. If these methods are not available we encourage authors, if this is reasonable, to estimate binary fractions and orbital parameter distributions for the full separation range.
In previous work we have also referred to peripheral fragmentation as “BD-like” formation. We do not use this term here since BDs likely form both star-like and peripherally and it suggests an answer to the question at hand.
For a discussion of the concept of Universality, see Marks et al. (2015).
After all, the majority of field stars investigated by the Kepler space-telescope are known to harbour planets. We ask how this would be possible if circumstellar disks of now planet-harbouring stars are destroyed in their parent clusters.
Acknowledgments
This paper originated from a discussion between P.K. and the IAC brown dwarf group during P.K.’s visit in June 2015, and we thank Alejandro Vazdekis for funding this visit. E.M. is supported by grant AYA2015-69350-C3-1-P and N.L. and V.J.S.B. are supported by grant AYA2015-69350-C3–2-P both from the Spanish Ministry of Economy and Competitiveness (MINECO).
References
- André, P., Di Francesco, J., Ward-Thompson, D., et al. 2014, Protostars and Planets VI, 27 [Google Scholar]
- Andrews, S. M., Rosenfeld, K. A., Kraus, A. L., & Wilner, D. J. 2013, ApJ, 771, 129 [NASA ADS] [CrossRef] [Google Scholar]
- Basu, S., & Vorobyov, E. I. 2012, ApJ, 750, 30 [NASA ADS] [CrossRef] [Google Scholar]
- Bate, M. R. 2009, MNRAS, 392, 590 [NASA ADS] [CrossRef] [Google Scholar]
- Bate, M. R. 2011, MNRAS, 418, 703 [NASA ADS] [CrossRef] [Google Scholar]
- Bate, M. R. 2012, MNRAS, 419, 3115 [NASA ADS] [CrossRef] [Google Scholar]
- Bate, M. R., & Bonnell, I. A. 2005, MNRAS, 356, 1201 [NASA ADS] [CrossRef] [Google Scholar]
- Bate, M. R., Bonnell, I. A., & Bromm, V. 2002, MNRAS, 332, L65 [NASA ADS] [CrossRef] [Google Scholar]
- Bate, M. R., Bonnell, I. A., & Bromm, V. 2003, MNRAS, 339, 577 [NASA ADS] [CrossRef] [Google Scholar]
- Bayo, A., Barrado, D., Huélamo, N., et al. 2012, A&A, 547, A80 [NASA ADS] [CrossRef] [EDP Sciences] [Google Scholar]
- Bergfors, C., Brandner, W., Janson, M., et al. 2010, A&A, 520, A54 [NASA ADS] [CrossRef] [EDP Sciences] [Google Scholar]
- Bihain, G., Rebolo, R., Béjar, V. J. S., et al. 2006, A&A, 458, 805 [NASA ADS] [CrossRef] [EDP Sciences] [Google Scholar]
- Bihain, G., Rebolo, R., Zapatero Osorio, M. R., et al. 2009, A&A, 506, 1169 [NASA ADS] [CrossRef] [EDP Sciences] [Google Scholar]
- Bonnell, I. A., Clarke, C. J., & Bate, M. R. 2006, MNRAS, 368, 1296 [NASA ADS] [CrossRef] [Google Scholar]
- Bonnell, I. A., Clark, P., & Bate, M. R. 2008, MNRAS, 389, 1556 [NASA ADS] [CrossRef] [Google Scholar]
- Boss, A. P. 2001, ApJ, 551, L167 [NASA ADS] [CrossRef] [Google Scholar]
- Briceño, C., Luhman, K. L., Hartmann, L., Stauffer, J. R., & Kirkpatrick, J. D. 2002, ApJ, 580, 317 [NASA ADS] [CrossRef] [Google Scholar]
- Burgasser, A. J., Reid, I. N., Siegler, N., et al. 2007, Protostars and Planets V, 427 [Google Scholar]
- Caballero, J. A. 2008, MNRAS, 383, 375 [NASA ADS] [Google Scholar]
- Caballero, J. A., Béjar, V. J. S., Rebolo, R., et al. 2007, A&A, 470, 903 [NASA ADS] [CrossRef] [EDP Sciences] [Google Scholar]
- Chen, X., Arce, H. G., Zhang, Q., et al. 2013, ApJ, 768, 110 [NASA ADS] [CrossRef] [Google Scholar]
- Cortés-Contreras, M., Béjar, V. J. S., Caballero, J. A., et al. 2017, A&A, 597, A47 [NASA ADS] [CrossRef] [EDP Sciences] [Google Scholar]
- Daemgen, S., Bonavita, M., Jayawardhana, R., Lafrenière, D., & Janson, M. 2015, ApJ, 799, 155 [NASA ADS] [CrossRef] [Google Scholar]
- Delfosse, X., Beuzit, J.-L., Marchal, L., et al. 2004, in Spectroscopically and Spatially Resolving the Components of the Close Binary Stars, eds. R. W. Hilditch, H. Hensberge, & K. Pavlovski, ASP Conf. Ser., 318, 166 [Google Scholar]
- Dieterich, S. B., Henry, T. J., Golimowski, D. A., Krist, J. E., & Tanner, A. M. 2012, AJ, 144, 64 [Google Scholar]
- Downes, J. J., Briceño, C., Mateu, C., et al. 2014, MNRAS, 444, 1793 [NASA ADS] [CrossRef] [Google Scholar]
- Duchêne, G., & Kraus, A. 2013, ARA&A, 51, 269 [Google Scholar]
- Duquennoy, A., & Mayor, M. 1991, A&A, 248, 485 [NASA ADS] [Google Scholar]
- Elmegreen, B. G. 2011, ApJ, 731, 61 [NASA ADS] [CrossRef] [Google Scholar]
- Evans, T. M., Ireland, M. J., Kraus, A. L., et al. 2012, ApJ, 744, 120 [NASA ADS] [CrossRef] [Google Scholar]
- Fischer, D. A., & Marcy, G. W. 1992, ApJ, 396, 178 [NASA ADS] [CrossRef] [Google Scholar]
- Forgan, D., & Rice, K. 2013, MNRAS, 432, 3168 [NASA ADS] [CrossRef] [Google Scholar]
- Forgan, D., Parker, R. J., & Rice, K. 2015, MNRAS, 447, 836 [NASA ADS] [CrossRef] [Google Scholar]
- Ghez, A. M., Neugebauer, G., & Matthews, K. 1993, AJ, 106, 2005 [NASA ADS] [CrossRef] [Google Scholar]
- Gomez, M., Hartmann, L., Kenyon, S. J., & Hewett, R. 1993, AJ, 105, 1927 [NASA ADS] [CrossRef] [Google Scholar]
- Goodwin, S. S. P. 2010, Philos. Trans., Ser. A, Math. Phys. Eng. Sci., 368, 851 [Google Scholar]
- Goodwin, S. P., Whitworth, A. P., & Ward-Thompson, D. 2004, A&A, 419, 543 [NASA ADS] [CrossRef] [EDP Sciences] [Google Scholar]
- Grether, D., & Lineweaver, C. H. 2006, ApJ, 640, 1051 [NASA ADS] [CrossRef] [Google Scholar]
- Guieu, S., Dougados, C., Monin, J.-L., Magnier, E., & Martín, E. L. 2006, A&A, 446, 485 [NASA ADS] [CrossRef] [EDP Sciences] [Google Scholar]
- Haisch, Jr., K. E., Lada, E. A., & Lada, C. J. 2001, ApJ, 553, L153 [NASA ADS] [CrossRef] [Google Scholar]
- Hennebelle, P., & Chabrier, G. 2008, ApJ, 684, 395 [NASA ADS] [CrossRef] [Google Scholar]
- Hernández, J., Hartmann, L., Calvet, N., et al. 2008, ApJ, 686, 1195 [NASA ADS] [CrossRef] [Google Scholar]
- Hester, J. J., Scowen, P. A., Sankrit, R., et al. 1996, AJ, 111, 2349 [NASA ADS] [CrossRef] [Google Scholar]
- Janson, M., Bergfors, C., Brandner, W., et al. 2014, ApJ, 789, 102 [Google Scholar]
- Janson, M., Hormuth, F., Bergfors, C., et al. 2012, ApJ, 754, 44 [NASA ADS] [CrossRef] [Google Scholar]
- Jódar, E., Pérez-Garrido, A., Díaz-Sánchez, A., et al. 2013, MNRAS, 429, 859 [NASA ADS] [CrossRef] [Google Scholar]
- Joergens, V., Bonnefoy, M., Liu, Y., Bayo, A., & Wolf, S. 2015, in Cambridge Workshop on Cool Stars, Stellar Systems, and the Sun, Stellar Systems, and the Sun, eds. G. T. van Belle, & H. C. Harris, 18th Cambridge Workshop on Cool Stars, 18, 1019 [Google Scholar]
- Kenyon, S. J., Dobrzycka, D., & Hartmann, L. 1994, AJ, 108, 1872 [NASA ADS] [CrossRef] [Google Scholar]
- Kenyon, S. J., Gómez, M., & Whitney, B. A. 2008, Low Mass Star Formation in the Taurus-Auriga Clouds, ed. B. Reipurth, 405 [Google Scholar]
- Kirk, H., & Myers, P. C. 2012, ApJ, 745, 131 [NASA ADS] [CrossRef] [Google Scholar]
- Klessen, R. S., Spaans, M., & Jappsen, A.-K. 2007, MNRAS, 374, L29 [NASA ADS] [CrossRef] [Google Scholar]
- Kohler, R., & Leinert, C. 1998, A&A, 331, 977 [NASA ADS] [Google Scholar]
- Konopacky, Q. M., Ghez, A. M., Rice, E. L., & Duchêne, G. 2007, ApJ, 663, 394 [NASA ADS] [CrossRef] [Google Scholar]
- Kraus, A. L., & Hillenbrand, L. A. 2009, ApJ, 703, 1511 [NASA ADS] [CrossRef] [Google Scholar]
- Kraus, A. L., & Hillenbrand, L. A. 2012, ApJ, 757, 141 [NASA ADS] [CrossRef] [Google Scholar]
- Kraus, A. L., White, R. J., & Hillenbrand, L. A. 2006, ApJ, 649, 306 [NASA ADS] [CrossRef] [Google Scholar]
- Kraus, A. L., Ireland, M. J., Martinache, F., & Hillenbrand, L. A. 2011, ApJ, 731, 8 [NASA ADS] [CrossRef] [Google Scholar]
- Kroupa, P. 1995, MNRAS, 277, 1507 [NASA ADS] [Google Scholar]
- Kroupa, P. 2011, in Computational Star Formation, eds. J. Alves, B. G. Elmegreen, J. M. Girart, & V. Trimble, IAU Symp., 270, 141 [Google Scholar]
- Kroupa, P., & Bouvier, J. 2003a, MNRAS, 346, 369 [NASA ADS] [CrossRef] [Google Scholar]
- Kroupa, P., & Bouvier, J. 2003b, MNRAS, 346, 343 [NASA ADS] [CrossRef] [Google Scholar]
- Kroupa, P., & Petr-Gotzens, M. G. 2011, A&A, 529, A92 [NASA ADS] [CrossRef] [EDP Sciences] [Google Scholar]
- Kroupa, P., Aarseth, S., & Hurley, J. 2001, MNRAS, 321, 699 [NASA ADS] [CrossRef] [Google Scholar]
- Kroupa, P., Bouvier, J., Duchêne, G., & Moraux, E. 2003, MNRAS, 346, 354 [NASA ADS] [CrossRef] [Google Scholar]
- Kroupa, P., Weidner, C., Pflamm-Altenburg, J., et al. 2013, The Stellar and Sub-Stellar Initial Mass Function of Simple and Composite Populations, eds. T. D. Oswalt, & G. Gilmore, 115 [Google Scholar]
- Lafrenière, D., Jayawardhana, R., van Kerkwijk, M. H., Brandeker, A., & Janson, M. 2014, ApJ, 785, 47 [NASA ADS] [CrossRef] [Google Scholar]
- Larson, R. B. 1998, MNRAS, 301, 569 [NASA ADS] [CrossRef] [Google Scholar]
- Leigh, N. W. C., Giersz, M., Marks, M., et al. 2015, MNRAS, 446, 226 [NASA ADS] [CrossRef] [Google Scholar]
- Leinert, C., Zinnecker, H., Weitzel, N., et al. 1993, A&A, 278, 129 [NASA ADS] [Google Scholar]
- Li, Y., Kouwenhoven, M. B. N., Stamatellos, D., & Goodwin, S. P. 2015, ApJ, 805, 116 [NASA ADS] [CrossRef] [Google Scholar]
- Lodieu, N. 2013, MNRAS, 431, 3222 [NASA ADS] [CrossRef] [Google Scholar]
- Lodieu, N., Zapatero Osorio, M. R., Rebolo, R., Martín, E. L., & Hambly, N. C. 2009, A&A, 505, 1115 [NASA ADS] [CrossRef] [EDP Sciences] [Google Scholar]
- Lomax, O., Whitworth, A. P., Hubber, D. A., Stamatellos, D., & Walch, S. 2015, MNRAS, 447, 1550 [NASA ADS] [CrossRef] [Google Scholar]
- Lomax, O., Whitworth, A. P., & Hubber, D. A. 2016, MNRAS, 458, 1242 [NASA ADS] [CrossRef] [Google Scholar]
- Low, C., & Lynden-Bell, D. 1976, MNRAS, 176, 367 [NASA ADS] [Google Scholar]
- Luhman, K. L. 2004, ApJ, 617, 1216 [NASA ADS] [CrossRef] [Google Scholar]
- Luhman, K. L. 2012, ARA&A, 50, 65 [NASA ADS] [CrossRef] [Google Scholar]
- Luhman, K. L., & Mamajek, E. E. 2012, ApJ, 758, 31 [NASA ADS] [CrossRef] [Google Scholar]
- Luhman, K. L., Allen, L. E., Allen, P. R., et al. 2008a, ApJ, 675, 1375 [NASA ADS] [CrossRef] [Google Scholar]
- Luhman, K. L., Hernández, J., Downes, J. J., Hartmann, L., & Briceño, C. 2008b, ApJ, 688, 362 [NASA ADS] [CrossRef] [Google Scholar]
- Luhman, K. L., Mamajek, E. E., Allen, P. R., & Cruz, K. L. 2009, ApJ, 703, 399 [NASA ADS] [CrossRef] [Google Scholar]
- Luhman, K. L., Allen, P. R., Espaillat, C., Hartmann, L., & Calvet, N. 2010, ApJS, 189, 353 [NASA ADS] [CrossRef] [Google Scholar]
- Machida, M. N., Tomisaka, K., Matsumoto, T., & Inutsuka, S.-I. 2008, ApJ, 677, 327 [NASA ADS] [CrossRef] [Google Scholar]
- Mamajek, E. E. 2009, in AIP Conf. Ser., eds. T. Usuda, M. Tamura, & M. Ishii, 158, 3 [Google Scholar]
- Marcy, G. W., & Butler, R. P. 2000, PASP, 112, 137 [NASA ADS] [CrossRef] [Google Scholar]
- Marks, M., & Kroupa, P. 2011, MNRAS, 417, 1702 [NASA ADS] [CrossRef] [Google Scholar]
- Marks, M., & Kroupa, P. 2012, A&A, 543, A14 [NASA ADS] [CrossRef] [EDP Sciences] [Google Scholar]
- Marks, M., Kroupa, P., & Oh, S. 2011, MNRAS, 417, 1684 [NASA ADS] [CrossRef] [Google Scholar]
- Marks, M., Leigh, N., Giersz, M., et al. 2014, MNRAS, 441, 3503 [NASA ADS] [CrossRef] [Google Scholar]
- Marks, M., Janson, M., Kroupa, P., Leigh, N., & Thies, I. 2015, MNRAS, 452, 1014 [NASA ADS] [CrossRef] [Google Scholar]
- Mohanty, S., Greaves, J., Mortlock, D., et al. 2013, ApJ, 773, 168 [NASA ADS] [CrossRef] [Google Scholar]
- Muzerolle, J., Allen, L. E., Megeath, S. T., Hernández, J., & Gutermuth, R. A. 2010, ApJ, 708, 1107 [NASA ADS] [CrossRef] [Google Scholar]
- Padoan, P., & Nordlund, Å. 2002, ApJ, 576, 870 [Google Scholar]
- Padoan, P., & Nordlund, Å. 2004, ApJ, 617, 559 [NASA ADS] [CrossRef] [Google Scholar]
- Palau, A., Zapata, L. A., Rodríguez, L. F., et al. 2014, MNRAS, 444, 833 [NASA ADS] [CrossRef] [Google Scholar]
- Parker, R. J., Goodwin, S. P., Kroupa, P., & Kouwenhoven, M. B. N. 2009, MNRAS, 397, 1577 [NASA ADS] [CrossRef] [Google Scholar]
- Parker, R. J., Maschberger, T., & Alves de Oliveira, C. 2012, MNRAS, 426, 3079 [NASA ADS] [CrossRef] [Google Scholar]
- Peña Ramírez, K., Béjar, V. J. S., Zapatero Osorio, M. R., Petr-Gotzens, M. G., & Martín, E. L. 2012, ApJ, 754, 30 [NASA ADS] [CrossRef] [Google Scholar]
- Pfalzner, S., Olczak, C., & Eckart, A. 2006, A&A, 454, 811 [NASA ADS] [CrossRef] [EDP Sciences] [Google Scholar]
- Pfalzner, S., Steinhausen, M., & Menten, K. 2014, ApJ, 793, L34 [NASA ADS] [CrossRef] [Google Scholar]
- Phan-Bao, N., Lee, C.-F., Ho, P. T. P., Dang-Duc, C., & Li, D. 2014, ApJ, 795, 70 [NASA ADS] [CrossRef] [Google Scholar]
- Raghavan, D., McAlister, H. A., Henry, T. J., et al. 2010, ApJS, 190, 1 [NASA ADS] [CrossRef] [EDP Sciences] [Google Scholar]
- Rees, M. J. 1976, MNRAS, 176, 483 [NASA ADS] [CrossRef] [Google Scholar]
- Reipurth, B., & Clarke, C. 2001, AJ, 122, 432 [NASA ADS] [CrossRef] [Google Scholar]
- Reipurth, B., Clarke, C. J., Boss, A. P., et al. 2014, Protostars and Planets VI, 267 [Google Scholar]
- Ricci, L., Testi, L., Natta, A., et al. 2014, ApJ, 791, 20 [NASA ADS] [CrossRef] [Google Scholar]
- Scholz, A., Muzic, K., Geers, V., et al. 2012, ApJ, 744, 6 [NASA ADS] [CrossRef] [Google Scholar]
- Silk, J. 1977, ApJ, 214, 152 [NASA ADS] [CrossRef] [Google Scholar]
- Simon, M., Ghez, A. M., Leinert, C., et al. 1995, ApJ, 443, 625 [NASA ADS] [CrossRef] [Google Scholar]
- Stamatellos, D., & Herczeg, G. J. 2015, MNRAS, 449, 3432 [NASA ADS] [CrossRef] [Google Scholar]
- Stamatellos, D., & Whitworth, A. P. 2009, MNRAS, 392, 413 [Google Scholar]
- Thies, I., & Kroupa, P. 2007, ApJ, 671, 767 [NASA ADS] [CrossRef] [Google Scholar]
- Thies, I., & Kroupa, P. 2008, MNRAS, 390, 1200 [NASA ADS] [CrossRef] [Google Scholar]
- Thies, I., Kroupa, P., & Theis, C. 2005, MNRAS, 364, 961 [NASA ADS] [CrossRef] [Google Scholar]
- Thies, I., Kroupa, P., Goodwin, S. P., Stamatellos, D., & Whitworth, A. P. 2010, ApJ, 717, 577 [NASA ADS] [CrossRef] [Google Scholar]
- Thies, I., Pflamm-Altenburg, J., Kroupa, P., & Marks, M. 2015, ApJ, 800, 72 [NASA ADS] [CrossRef] [Google Scholar]
- Todorov, K. O., Luhman, K. L., Konopacky, Q. M., et al. 2014, ApJ, 788, 40 [NASA ADS] [CrossRef] [Google Scholar]
- Tokovinin, A. 2014, AJ, 147, 87 [NASA ADS] [CrossRef] [Google Scholar]
- Torres, R. M., Loinard, L., Mioduszewski, A. J., et al. 2012, ApJ, 747, 18 [NASA ADS] [CrossRef] [Google Scholar]
- Umbreit, S., Burkert, A., Henning, T., Mikkola, S., & Spurzem, R. 2005, ApJ, 623, 940 [NASA ADS] [CrossRef] [Google Scholar]
- Vorobyov, E. I. 2016, A&A, 590, A115 [NASA ADS] [CrossRef] [EDP Sciences] [Google Scholar]
- Ward-Duong, K., Patience, J., De Rosa, R. J., et al. 2015, MNRAS, 449, 2618 [NASA ADS] [CrossRef] [Google Scholar]
- Whitworth, A. P., & Zinnecker, H. 2004, A&A, 427, 299 [NASA ADS] [CrossRef] [EDP Sciences] [Google Scholar]
- Wichmann, R., Bastian, U., Krautter, J., Jankovics, I., & Rucinski, S. M. 1998, MNRAS, 301, L39 [NASA ADS] [CrossRef] [Google Scholar]
- Wilson, P. A., Hébrard, G., Santos, N. C., et al. 2016, A&A, 588, A144 [NASA ADS] [CrossRef] [EDP Sciences] [Google Scholar]
- Zapatero Osorio, M. R., Gálvez Ortiz, M. C., Bihain, G., et al. 2014, A&A, 568, A77 [NASA ADS] [CrossRef] [EDP Sciences] [Google Scholar]
All Tables
All Figures
|
Fig. 1 Stellar and substellar IMF are disjoint in the present model (black histograms). The dotted lines indicate an underlying power law of the mass spectrum in the form dN/ dm ∝ m− α with α = 0.3,1.3, and 2.3 (from left to right). Objects from the peripheral branch of the IMF lying above the HBML (vertical dashed line) are stars forming in circumstellar disks and star-like BDs stem from the stellar branch of the IMF lying below the HBML. Both populations mix and form the system IMF (31% and ≈ 100% binary fraction for the BD and stellar branch, respectively; see Sect. 3.1). The discontinuity is thus hidden from an observer (grey histogram). Figure taken from Marks et al. (2015). |
| In the text | |
|
Fig. 2 Separation distribution for stars and BDs in the model (curves, Sect. 3.2) in comparison with observational data on stellar binarity in Taurus (symbols with |
| In the text | |
|
Fig. 3 Prediction of the primary-mass dependent binary fraction in dependence of resolution limit, if peripheral fragmentation applies (the discontinuous IMF model in Fig. 1). Left: binary fraction as a function of primary mass for the initial binary population with no dynamical evolution is plotted (Sect. 3.2). The different curves denote the trend for varying survey resolution limits; binaries with separations larger than 0, 1, 3, 5, 7, 10, 50, 100, and 200 AU (top to bottom) are resolved. Binaries with separations smaller than the respective resolution limits are counted as single in the model. The solid cross denotes the Daemgen et al. (2015) estimation that 62 ± 14% of solar-type Taurus members over the full separation range are multiples, in concordance with Kraus et al. (2011) finding that about 2/3−3/4 of their targets in Taurus are binaries or higher order multiples. The dashed crosses are data from Todorov et al. (2014) who resolve separations a> 10 AU. Right: same as left panel but with dynamical evolution in the Taurus-Auriga groups added (see Sect. 3.2). |
| In the text | |
Current usage metrics show cumulative count of Article Views (full-text article views including HTML views, PDF and ePub downloads, according to the available data) and Abstracts Views on Vision4Press platform.
Data correspond to usage on the plateform after 2015. The current usage metrics is available 48-96 hours after online publication and is updated daily on week days.
Initial download of the metrics may take a while.