Fig. 2
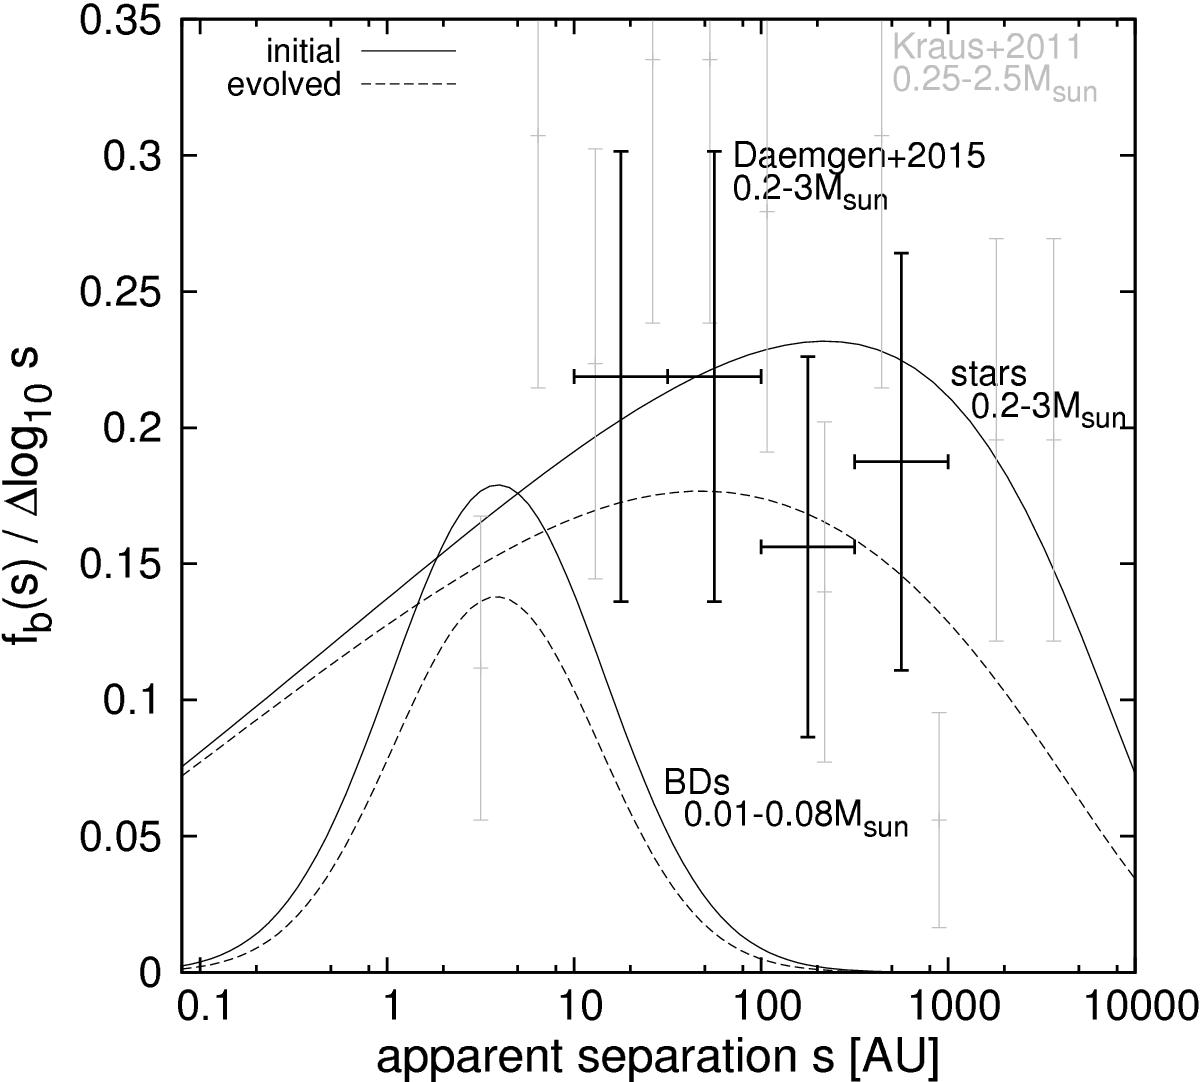
Separation distribution for stars and BDs in the model (curves, Sect. 3.2) in comparison with observational data on stellar binarity in Taurus (symbols with ![]() errors; Kraus et al. 2011; Daemgen et al. 2015). The Daemgen et al. (2015) data are constructed using the physically bound pairs among 64 targets associated with Taurus (their Table 2, see Sect. 2). The solid curves show the initial BD and stellar late-type population in the model. The dashed curves depict the resulting distributions after allowing for little evolution in the Taurus-Auriga groups (see Sect. 3.2). The BD distributions result from the addition of BDs from both IMF branches (Fig. 1).
errors; Kraus et al. 2011; Daemgen et al. 2015). The Daemgen et al. (2015) data are constructed using the physically bound pairs among 64 targets associated with Taurus (their Table 2, see Sect. 2). The solid curves show the initial BD and stellar late-type population in the model. The dashed curves depict the resulting distributions after allowing for little evolution in the Taurus-Auriga groups (see Sect. 3.2). The BD distributions result from the addition of BDs from both IMF branches (Fig. 1).
Current usage metrics show cumulative count of Article Views (full-text article views including HTML views, PDF and ePub downloads, according to the available data) and Abstracts Views on Vision4Press platform.
Data correspond to usage on the plateform after 2015. The current usage metrics is available 48-96 hours after online publication and is updated daily on week days.
Initial download of the metrics may take a while.