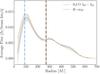
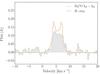
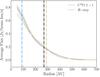
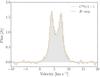
Fig. 7

Radial intensity and spectra of observed H2CO 303–202 and C18O 2–1 versus the best-fit models. Left: radial intensity curves from azimuthally-averaged elliptical annuli projected to i = 44°, PA = 133°. HD 163296 data is show in black, best-fits for H2CO and C18O are in gold. The vertical dashed lines indicate the CO snow line (blue dash) from Qi et al. (2015), the 5σ outer radius of the 1.3 mm grains (black dash), and the change-over radii, Rc, for the best-fit radial step-abundance models (gold dash). H2CO profiles are taken from integrated intensity maps after applying a Keplerian mask. Right: disk-integrated spectra. HD 163296 data is shown in filled gray. H2CO spectra are Hanning smoothed to 0.336 km s-1 channels.
Current usage metrics show cumulative count of Article Views (full-text article views including HTML views, PDF and ePub downloads, according to the available data) and Abstracts Views on Vision4Press platform.
Data correspond to usage on the plateform after 2015. The current usage metrics is available 48-96 hours after online publication and is updated daily on week days.
Initial download of the metrics may take a while.