Fig. 3
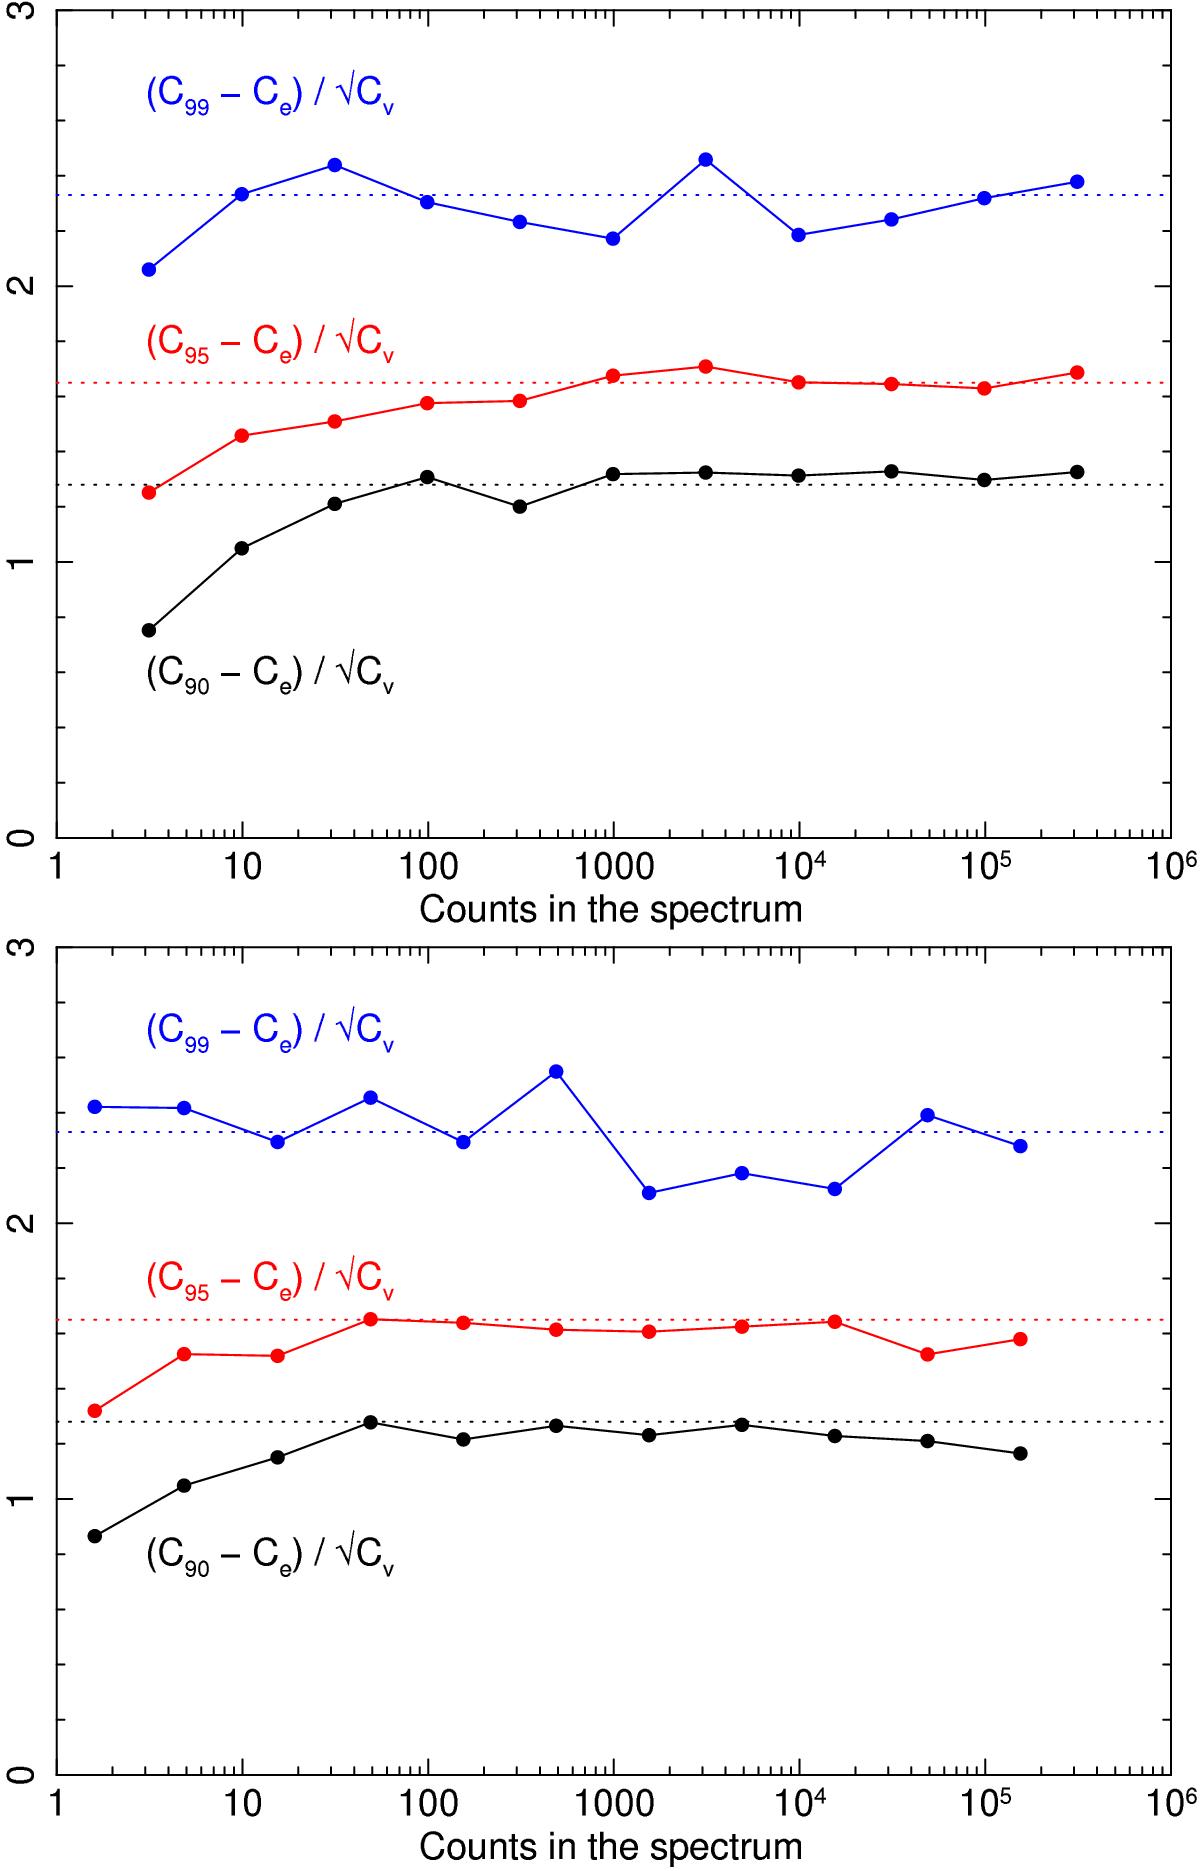
Percentile points 90%, 95%, and 99% for the distribution of C for simulated Perseus (top) and Capella (bottom) spectra. The expected value Ce was subtracted and the difference is scaled with ![]() . The percentile points are shown as a function of the average number of counts in the spectra. The dotted lines show the expected percentile values if the distribution of C had been normal. These values are reached asymptotically for large numbers of counts in the spectra.
. The percentile points are shown as a function of the average number of counts in the spectra. The dotted lines show the expected percentile values if the distribution of C had been normal. These values are reached asymptotically for large numbers of counts in the spectra.
Current usage metrics show cumulative count of Article Views (full-text article views including HTML views, PDF and ePub downloads, according to the available data) and Abstracts Views on Vision4Press platform.
Data correspond to usage on the plateform after 2015. The current usage metrics is available 48-96 hours after online publication and is updated daily on week days.
Initial download of the metrics may take a while.