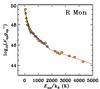
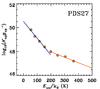
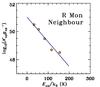
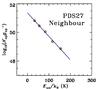
Fig. 4
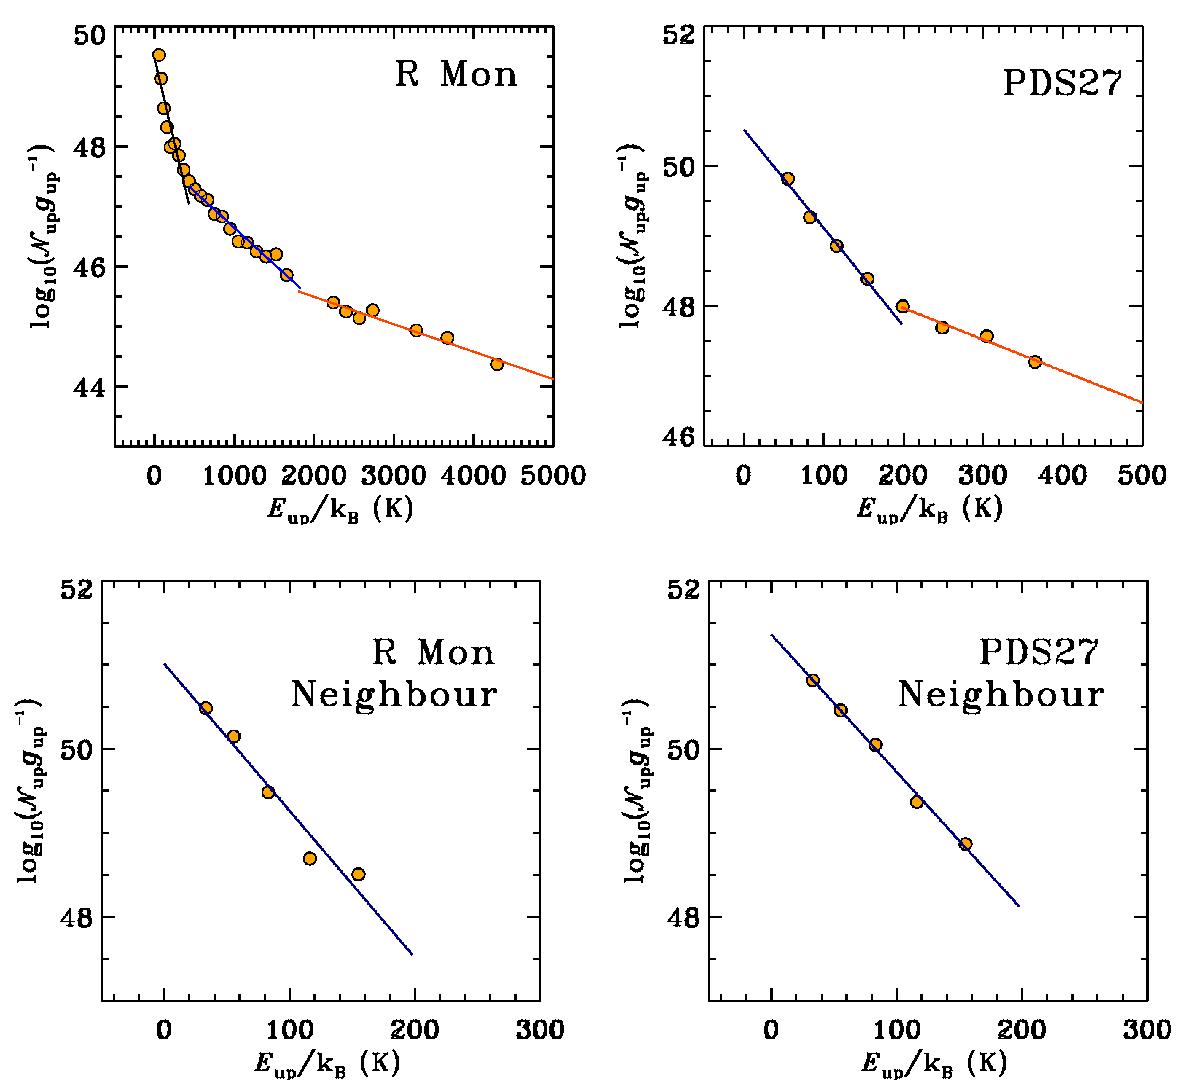
CO rotational diagrams for R Mon, PDS 27 and their compact neighbours. The emission can be divided into three different components for R Mon and two components for PDS 27: a cold component (for R Mon) is shown as a black line, whereas a warm and a hot component are represented by a blue and orange line, respectively. For the neighbours, only a single cold component is observed, represented by a blue line.
Current usage metrics show cumulative count of Article Views (full-text article views including HTML views, PDF and ePub downloads, according to the available data) and Abstracts Views on Vision4Press platform.
Data correspond to usage on the plateform after 2015. The current usage metrics is available 48-96 hours after online publication and is updated daily on week days.
Initial download of the metrics may take a while.