Fig. 6
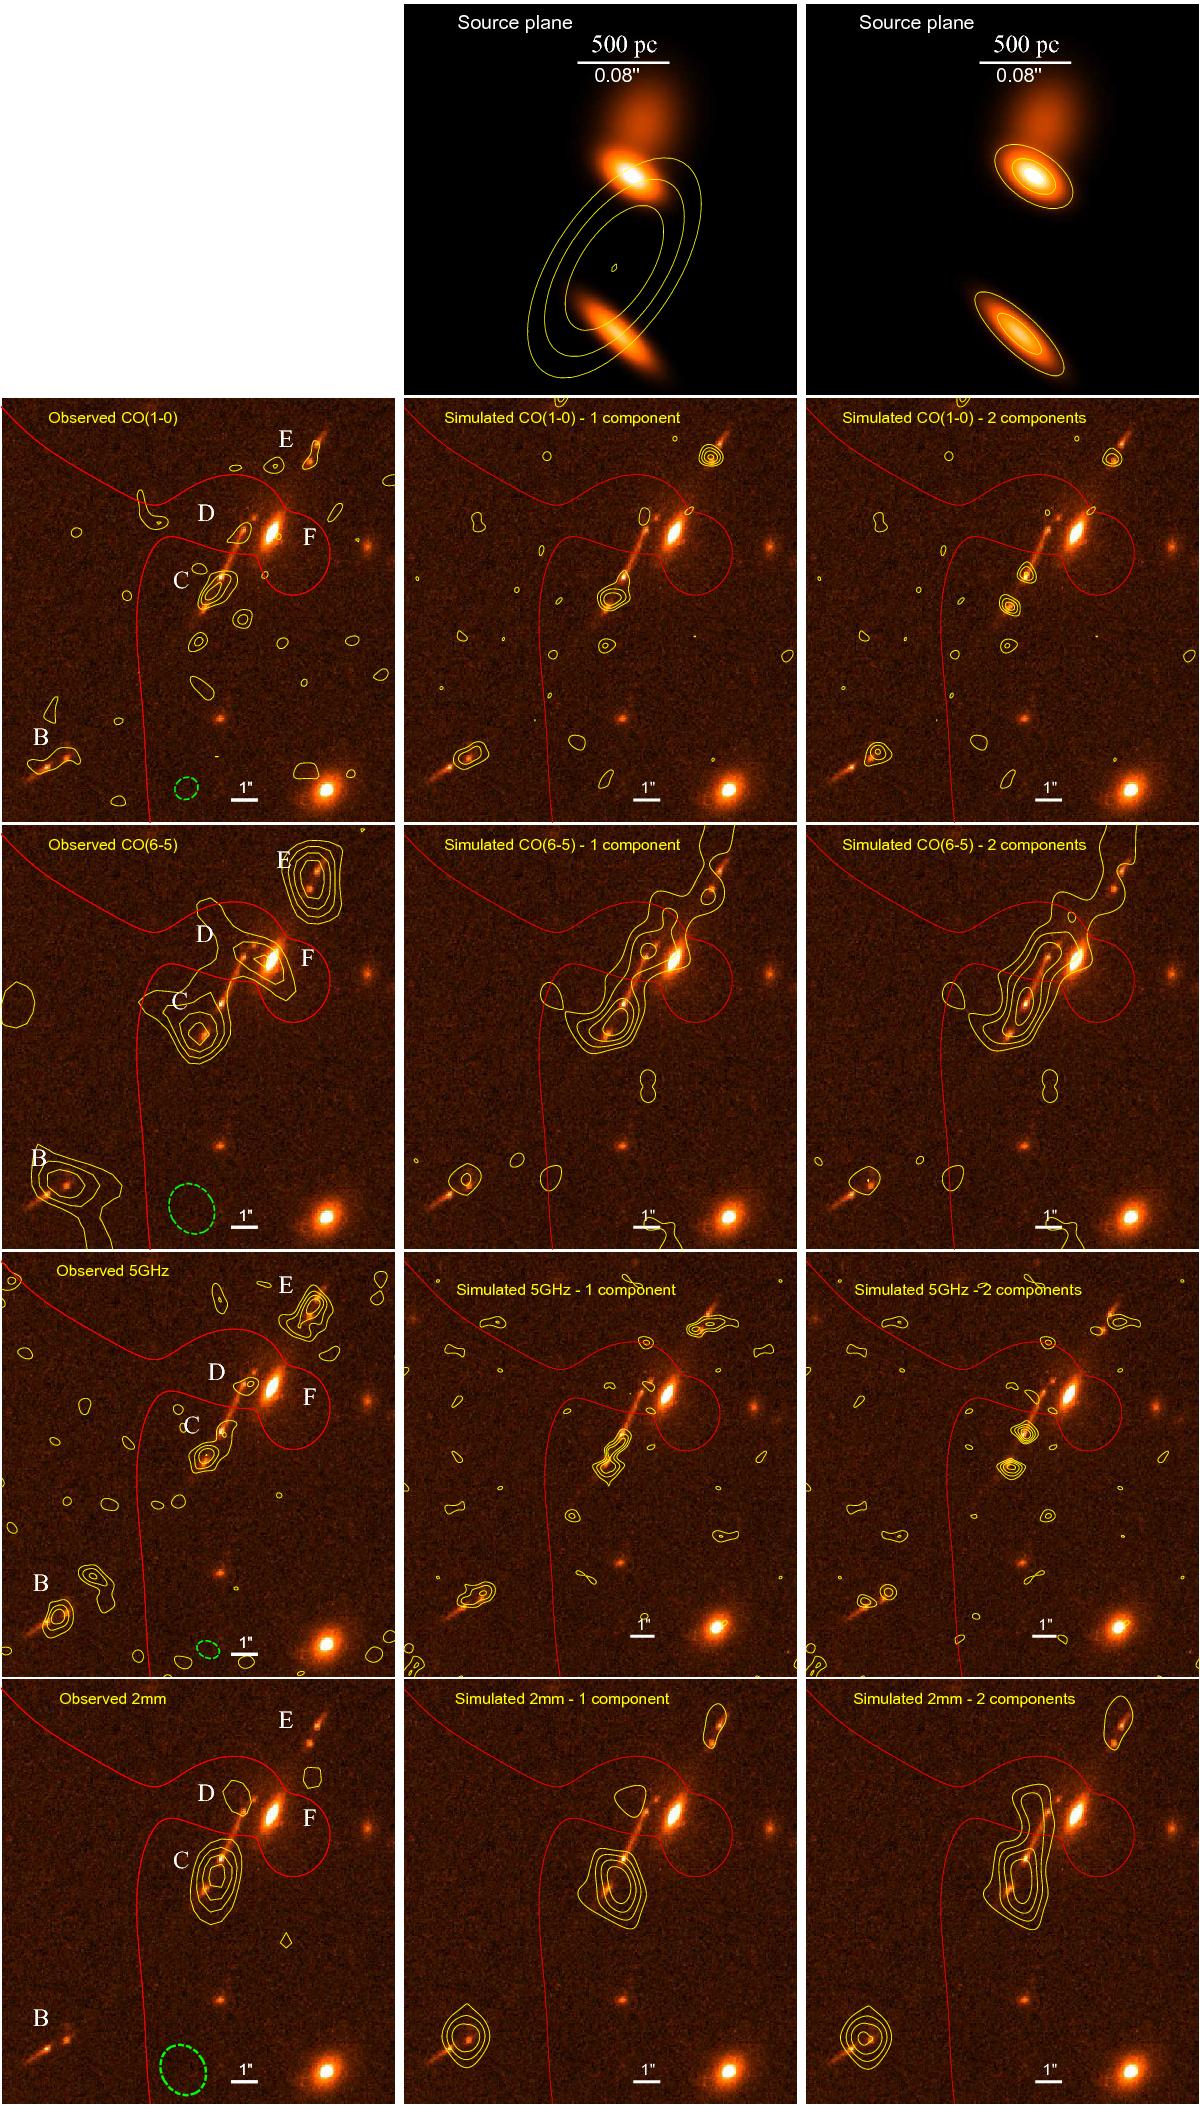
Comparison of the observed JVLA CO(1–0) line emission, PdBI CO(6–5) line emission, JVLA 5 GHz continuum, and PdBI 2 mm continuum contours, overlaid on the HST/ACS F814W multiple images B, C, D, and E of MACSJ0032-arc (left panels), with the respective simulated beam-convolved emission maps in the image plane (yellow contours in the middle and right panels) obtained for two different combinations of elliptical Gaussian light profiles in the source plane: one extended Gaussian component placed between the two HST UV-bright knots (yellow contours in the top middle panel) and two Gaussian components with locations and shapes following the two UV-bright knots (yellow contours in the top right panel). Noise realizations based on the data are added to the simulated maps, and the absolute flux scaling is obtained by matching the observed flux at the peak of the emission in the counter-image C in each of the CO(1–0), CO(6–5), 5 GHz, and 2 mm simulated maps. The critical line is in red. The size and orientation of the beams are indicated by the dashed green ellipses. Contour levels start at 2σ and are spaced in steps of 1σ (as in Fig. 2).
Current usage metrics show cumulative count of Article Views (full-text article views including HTML views, PDF and ePub downloads, according to the available data) and Abstracts Views on Vision4Press platform.
Data correspond to usage on the plateform after 2015. The current usage metrics is available 48-96 hours after online publication and is updated daily on week days.
Initial download of the metrics may take a while.