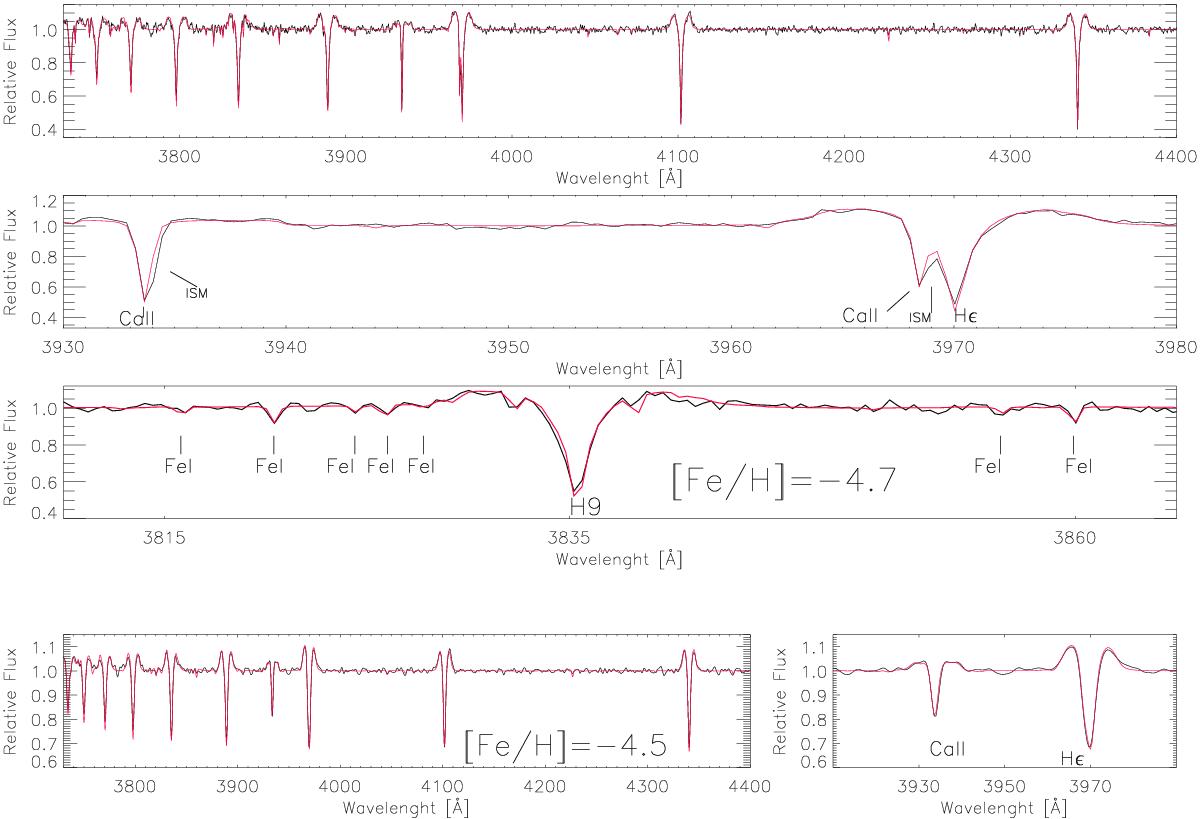
Fig. 1
VLT/X-shooter spectrum (R = 7900) of J1019+1729 (black line) and the best fit derived by FERRE (red line). From top to bottom: the entire spectrum (3700–4400 Å). The range of the Ca ii lines. The H9 spectral region with several Fe i lines assuming Teff = 5834 K, log g = 5.0 from our previous analysis over the entire spectra. The derived iron abundance is displayed. Finally the X-shooter spectrum smoothed to the OSIRIS resolution (R = 2500) and re-analyzed by FERRE: left panel shows the entire spectrum together with the derived metallicity while in the right panel a detail of the Ca ii lines is depicted.
Current usage metrics show cumulative count of Article Views (full-text article views including HTML views, PDF and ePub downloads, according to the available data) and Abstracts Views on Vision4Press platform.
Data correspond to usage on the plateform after 2015. The current usage metrics is available 48-96 hours after online publication and is updated daily on week days.
Initial download of the metrics may take a while.