| Issue |
A&A
Volume 604, August 2017
|
|
|---|---|---|
| Article Number | A59 | |
| Number of page(s) | 9 | |
| Section | Cosmology (including clusters of galaxies) | |
| DOI | https://doi.org/10.1051/0004-6361/201731237 | |
| Published online | 07 August 2017 | |
Observing the very low surface brightness dwarfs in a deep field in the VIRGO cluster: constraints on dark matter scenarios ⋆
INAF–Osservatorio Astronomico di Roma, via Frascati 33, 00078 Monteporzio, Italy
e-mail: This email address is being protected from spambots. You need JavaScript enabled to view it.
Received: 24 May 2017
Accepted: 13 June 2017
Abstract
We report the discovery of 11 very faint (r ≲ 23), low surface brightness (μr ≲ 27 mag/arcsec2) dwarf galaxies in one deep field in the Virgo cluster, obtained by the prime focus cameras (LBC) at the Large Binocular Telescope (LBT). These extend our previous sample to reach a total number of 27 galaxies in a field of just ~0.17 deg2 located at a median distance of 390 kpc from the cluster centre. The association of such galaxies with the Virgo cluster is supported by their separate position in the central surface brightness – total magnitude plane with respect to the background galaxies of similar total magnitude. For a significant fraction (26%) of the sample, the association to the cluster is confirmed by spectroscopic follow-up. We show that the mere abundance of satellite galaxies corresponding to our observed number in the target field provides extremely tight constraints on dark matter models with suppressed power spectrum compared to the cold dark matter case, independently of the galaxy luminosity distribution. In particular, the requirement that the observed number of satellite galaxies not exceed the predicted abundance of dark matter sub-halos yields a limit of mX ≥ 3 keV at 1-σ and mX ≥ 2.3 keV at 2-σ confidence level for the mass of thermal warm dark matter particles. Such a limit is competitive with other limits set by the abundance of ultra-faint satellite galaxies in the Milky Way, is completely independent of baryon physics involved in galaxy formation, and has the potentiality for appreciable improvements with future observations. We extend our analysis to dark matter models based on sterile neutrinos, showing that our observations set tight constraints on the combination of sterile neutrino mass mν and mixing parameter sin2(2θ). We discuss the robustness of our results with respect to systematics.
Key words: galaxies: clusters: individual: Coma cluster / dark matter
Based on observations made at the Large Binocular Telescope (LBT) at Mt. Graham (Arizona, USA).
© ESO, 2017
1. Introduction
The abundance of dwarf satellite galaxies constitutes a key probe for dark matter (DM) scenarios. In fact, such an abundance strongly depends on the shape of the DM power spectrum at small galactic scales, which in turn is determined by the assumed mass of the DM candidates. In particular, the low velocity dispersion of cold dark matter (CDM) particles results into large abundances of DM sub-halos around Milky Way-like galaxies which largely exceed (by a factor ≳20) the number of dwarf satellites observed around the Milky Way and M 31 (Klypin et al. 1999; Diemand et al. 2008; Springel et al. 2008, Ferrero et al. 2012). This means that a strong suppression of star formation in dwarf galaxies (due to feedback from both supernovae and reionization at high redshift) must be invoked in order to suppress the number of luminous satellites compared to the abundance of DM sub-halos (see e.g. Bullock et al. 2000; Benson et al. 2002; Sommerville 2002; Sawala et al. 2016). While the effectiveness of such processes in bringing the predicted abundance of dwarf galaxies in CDM in agreement with observations is still debated (see e.g. Schneider et al. 2017), alternative DM models based on spectra with suppressed power on small scales have been proposed by several groups to solve the discrepancy. Among these, a prominent class is constituted by models based on lighter DM particles with masses in the keV range. Compared to CDM particles, their larger thermal velocities suppress the growth of DM density fluctuations on small mass scales, M ≲ 109M⊙. Such DM candidates may be initially in thermal equilibrium (thermal warm dark matter models, WDM, see Bode et al. 2001; De Vega Sanchez 2010) or be produced from oscillations or decay of other particles, as in sterile neutrino models (Colombi et al. 1996; see Adhikari 2017, for an extended review). In the former case, the suppression in the power spectrum with respect to CDM depends only on the exact value of DM particle mass mX, since a thermalized species has no memory of the details of its production, while for sterile neutrinos the power spectrum depends on the production mechanism. For example, for sterile neutrinos produced by oscillations of active neutrinos, the power spectrum depends on both the mass mν and the mixing parameter sin2(2θ). It is noticeable that oscillations make such DM candidates subject to direct observational test, since the decay of sterile neutrinos might result into the emission of X-ray photons at an energy of ≈1/2 mν. In fact, a tentative line signal at an energy of ≈3.5 keV has already been reported in X- ray observations of stacked spectra of clusters of galaxies, as well as in several galaxy clusters (Bulbul et al. 2014; Boyarsky et al. 2014), in the X-ray emission of dwarf galaxies, of the Milky Way and of M31 (see, e.g., Sekiya et al. 2015; Jeltema & Profumo 2016; Riemer-Sørensen 2016; Adhikari et al. 2017, for an extended discussion), and in the X-ray background (Cappelluti et al. 2017).
Since the key mass scales to distinguish CDM from WDM candidates are sub-galactic scales (M ≲ 109M⊙), the abundance of low-mass dwarf galaxies has been extensively used to constrain both thermal WDM and sterile neutrino DM models. In the case of thermal relic WDM particles, the one-to-one correspondence between the WDM particle mass and the suppression in the power spectrum at small scales has allowed us to derive limits on mX by comparing the predictions from N-body WDM simulations or semi-analytic models with the abundance of observed ultra-faint satellites. On this basis, different authors have derived limits ranging from mX ≥ 1.5 keV (Lovell et al. 2014) to mX ≥ 1.8 keV (Horiuchi et al. 2014), mX ≥ 2 keV (Kennedy et al. 2014) and mX ≥ 2.3 keV (Polisensky & Ricotti 2011); relevant constraints have also been obtained for the parameter space of resonant production sterile neutrino models (Schneider 2016), in that latter case also taking into account the actual shape of the distribution functions (and, thus, not using a WDM approximation to a non-thermal case). We note, however, that such methods are sensitive to the assumed completeness corrections (see discussion in Abazajian et al. 2011; Schultz et al. 2014) and to the assumed values for the DM mass of the host halo and of the satellites. At higher redshifts, z ≈ 6, a limit of mX ≳ 1 keV has been derived from the UV luminosity functions of faint galaxies (MUV ≈ −16) in Schultz et al. (2014); a similar approach by Corasaniti et al. (2017) yields mX ≳ 1.5 keV. Since these approaches are based on the comparison between the observed luminosity functions and the predicted mass function of DM halos in different WDM models, the delicate issue in these methods is their dependence on the physics of baryons, determining the mass-to-light ratio of faint galaxies. Although to a lesser extent, uncertainties in the baryonic physics (related e.g. to the average photoionization history of the intergalactic medium (IGM) and to spatial fluctuations of the UV background) also affect (Garzilli et al. 2015; Viel et al. 2013; Irs˘ic˘et al. 2017; see also Baur et al. 2017) the tighter constraints achieved so far for WDM thermal relics, derived by comparing small scale structures in the Lyman-α forest of high-resolution (z> 4) quasar spectra with hydrodynamical N-body simulations (see Viel et al. 2013). The most recent results (Irs˘ic˘et al. 2017) yield mX ≳ 5.3 keV at 2-σ confidence level from the combined analysis of two samples, although allowing for a non-smooth evolution of the temperature of the IGM can reduce the lower limit for the combined analysis to mX ≥ 3.5 keV (for a generalization of this method to sterile neutrinos models, see Schneider 2016).
To bypass the uncertainties related to the physics of baryons affecting the constraints on DM models, Menci et al. (2016a,b) have exploited the downturn of the halo mass distribution φ(M,z) in models with suppressed power spectra, which yields a maximum number density  of DM halos in the cumulative mass distribution that in turn depends on the adopted DM model. Since luminous galaxies cannot outnumber DM halos, an observed galaxy density
  would rule out the adopted DM model independently of the baryonic processes determining the luminous properties of galaxies. Such a method, first applied to lensed galaxies at z = 10 in Pacucci et al. (2013) and to galaxies at z = 7 in the Hubble Deep Field in Lapi & Danese (2015), has acquired an increased potential with the first results of the Hubble Frontier Field (HFF) programme. By exploiting the magnification power of gravitational lensing produced by foreground clusters, HFF allows us to reach unprecedented faint magnitudes MUV = −12.5 in the measurement of the luminosity function of galaxies at z = 6 ( Livermore et al. 2017). The large number density φobs ≥ 1.3 Mpc-3 (at 2-σ confidence level) corresponding to the observed luminosity function allowed us to set a robust lower limit mX ≥ 2.5 keV (at 2-σ) to the mass of thermal relic WDM particles. This constitutes the tightest constraint derived so far on thermal WDM candidates independent of the baryon physics involved in galaxy formation.
However, systematics still affect the selection of highly magnified (typical amplifications >10 and as large as ~50–100 are involved), faint galaxies at high redshift, due to uncertainties related both to the lensing amplification and to the size distribution of faint galaxies. As for the lensing magnification, while the analysis in Livermore et al. (2017) shows that the uncertainties associated to the magnification of individual galaxy is reduced appreciably when the aggregated information is considered, the proper procedure to be adopted in deriving the variance in the luminosity function due to the magnification is still matter of debate (see Bouwens et al. 2017a). As for the size distribution of high-z galaxies, this strongly affects the completeness correction adopted in the estimates of the luminosity functions, since compact galaxies are more easily detected compared to the extended, low surface brightness ones (Grazian et al. 2011). While in the simulations carried out by Livermore et al. (2017) a normal distribution of half-light radii rh has been assumed with a peak at 500 pc, assuming values rh ≲ 100 pc would lead to a significant suppression of the faint-end logarithmic slope α of luminosity function being found (up to 10% in the case where rh = 40 pc, see Bouwens et al. 2017b). Maximizing the impact of both the above systematic effects would lead to looser constraints on the DM models (see Menci et al. 2017, for a detailed discussion).
Thus, it is important to complement the above high-redshift baryon-independent constraints with independent low-redshift limits derived from observables affected by completely different systematics. This would also allow us to cross-check the bounds on the parameter space of DM models through observations of dwarf galaxies across a huge lapse of cosmic times. While previously mentioned works mainly focused on Sloan Digital Sky Survey (SDSS) ultra-faint dwarf satellites of the Milky Way (Kennedy et al. 2014; Horiuchi et al. 2014; Lovell et al. 2014; Polisensky & Ricotti 2010), these still rely on the adopted corrections for the limited sky coverage of the SDSS, on the assumed mass of the Milky Way, and on the assumed lower limits for the mass of the dwarf galaxies. Such limits in turn depend on the baryon physics entering either the luminosity-to-mass ratio of dwarf galaxies, or the density profiles used to derive stellar velocity dispersion used to infer the dwarf galaxy masses. A complementary approach is to estimate the dwarf abundance in nearby clusters like Virgo or Coma. Searches in the Virgo cluster allow us to probe a confined volume in the local universe where the galaxy density is particularly high and where it is possible to select cluster members with high confidence. Cluster members are easily selected from combined observations of total magnitude and central surface brightness, since Virgo galaxies appear diffuse, with central surface brightness much fainter with respect to background galaxies of similar total magnitude. Spectroscopic confirmation of photometric candidates has proved the reliability of this selection criterion (Rines & Geller 2008). In addition, in the cluster environment a large dynamical range Msh/Mh ~ 10-5 in the mass ratio between the smaller sub-halo and the main halo is easily obtainable without reaching the same very faint limits and low dwarf masses as in the Milky Way halo. This large range allows a more accurate statistical description of the sub-halo distribution function together with a detailed investigation of the dynamical processes acting at the centre of the cluster.
In the present work we select low surface brightness (LSB) dwarf galaxies in the Virgo cluster, basing our selection on deep observations with the Large Binocular Telescope (LBT). We increase the Virgo dwarf sample we obtained in a previous paper (Giallongo et al. 2015), going deeper on a slightly larger area to evaluate a reliable lower limit to the total number density of faint dwarfs at a distance of about 390 kpc from the cluster centre. Since our method is based on the comparison of the total abundance of satellites with the prediction of different DM models, we do not need to derive luminosity functions or to make assumptions on the luminosity-to-mass ratio of the observed galaxies. Nevertheless, the mere increase in the observed abundance of galaxies in the target field compared to our earlier work, when extrapolated to the whole cluster, will provide stringent limits on the parameter space of both the thermal WDM and the sterile neutrino DM models.
The paper is organized as follows. The data sample and the selection procedure are described in Sect. 2. The method we adopt to compare the total abundance of galaxies in the observed field with the predictions of different DM models is presented in Sect. 3, where we also recall the basic properties of the different DM scenarios with which we compare. Our constraints on the DM models are presented in Sect. 4, while Sect. 5 is devoted to discussion and conclusions. Throughout the paper we adopt round cosmological parameters ΩΛ = 0.7, Ω0 = 0.3, and Hubble constant h = 0.7 in units of 100 km/s/Mpc. Magnitudes are in the AB photometric system.
2. Selection of VIRGO galaxy candidates in the field
In Giallongo et al. (2015, G15) we exploited archival LBT images, originally obtained by Lerchster et al. (2011), to select a sample of Virgo dwarf candidates over a ≈600 arcmin2 field located at ~350 kpc from the cluster centre. We detected 11 low surface brightness galaxies in the magnitude interval −13 ≲ Mr ≲ −9. Such LSB galaxies are similar – although fainter in some cases – to those found in previous works by for example Sabatini et al. (2003), Lieder et al. (2012), Davies et al. (2016), and by Ferrarese et al. (2012; 2016) on the basis of the Next Generation Virgo Cluster Survey (NGVS) survey at the Canada-France-Hawaii Telescope. The latter covers all the Virgo cluster for a total area of 100 deg2 and the large statistics allow us to derive a reliable faint-end slope of the Virgo luminosity function α ≃ −1.4 (Ferrarese et al. 2016). Since the goal of the present work is to derive an integrated lower limit to the number density of the dwarf Virgo galaxies, we decided to go deeper in a relatively small area at an intermediate distance from the Virgo centre as a complementary strategy to the surveys already completed in the overall Virgo cluster. The selection criterion is based on the detection of the faintest dwarfs in terms of their central surface brightness.
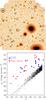 |
Fig. 1 Top panel: finding chart of our field around the bright galaxy NGC 4477. The area is 0.17 deg2. The image reaches a 2σ fluctuation in background surface brightness of the order of ~28.6 mag arcsec-2. Bottom panel: central surface brightness versus total Gunn-r magnitudes. The straight line represents the best fit of the correlation shown by the background galaxies (black points). Circles are LSB candidates selected in Paper I (after zeropoint correction by −0.1 mag). Red large squares are new VIRGO candidates selected from the present catalogue. |
As an intermediate step in this strategy, we obtained a deep Gunn-r image in a field partially overlapping with the previous one centred near the Virgo galaxy of the Markarian chain NGC 4477 at an average distance of ~390 kpc. More specifically, the lower and upper bounds in distance from the cluster centre are at 310 kpc and 464 kpc, respectively. The distances have been estimated adopting the Virgo distance of 16.5 Mpc derived by Mei et al. (2007) and a scale of about 80″/pc. Figure 1 (top panel) shows a finding chart of the field together with the positions of the Virgo confirmed members and new candidates. The new image has been obtained by the red channel of the Large Binocular Camera (Giallongo et al. 2008) at the prime focus of the 8m Large Binocular Telescope (LBT). The final mosaic which includes the original image used in G15 has a total exposure time ranging from 9 to 11.5 ks over a field of view of ~0.17 deg2 centred near NGC 4477. The image reaches a 2σ fluctuation in background surface brightness of the order of ~28.6 mag arcsec-2 in the deepest area. The resulting average seeing corresponds to a FWHM ≃ 0.85 arcsec.
The selection of Virgo galaxy candidates has been performed as in G15, exploiting the specific morphological properties of the Virgo galaxies in the central surface brightness – total magnitude plane, μ0−r. This criterion has been adopted by several authors (Conselice et al. 2002; Rines & Geller 2008) and its reliability has been extensively tested by spectroscopic follow-up of selected Virgo candidates. More specifically, as in G15 we have used the SExtractor package (Bertin & Arnouts 1996) to select sources setting a brightness limit of μr ≃ 27.5 in a minimum detection circular area of diameter 2.5 arcsec. We have also used a circular aperture equivalent to 1 arcsec2 as a first proxy of the central surface brightness of the diffuse sources.
In Fig. 1 (bottom panel) we plot the galaxies found down to r = 23 as a function of their central surface brightness. Only galaxies whose photometry is not contaminated by other nearby sources are shown after a σ clipping around the average linear regression. The locus can be described by a linear relation of the type μ0 = 0.94 × r + 2.99. At a first glance 27 galaxies are located well outside the locus of background galaxies ≳3σ away from the average locus of background galaxies. All 27 galaxies are clearly extended with low surface brightness and are selected as cluster members. Figure 1 also includes the 11 Virgo galaxies of G15. The candidates have been visually inspected to remove extended artefacts due to blending of background galaxies. As reported in G15, we emphasize that galaxies with characteristics similar to the selected Virgo dwarfs are absent in our database of even deeper LBC fields reaching limiting magnitudes of r ~ 26−27 obtained in different sky regions far away from any nearby cluster, for a total area of 0.17 deg2.
To better characterize the morphological and photometric properties of the Virgo candidates we have used the Galfit package (Peng et al. 2010) which performs radial profile modelling with Sérsic and other functions after convolution with the point spread function profile as done in G15. This approach is important in most cases where the LSB galaxy profile includes several overlapping compact sources which alter the estimate of LSB total magnitude and spatial profile. Thus small compact sources were simultaneously fitted with the main LSB galaxy to remove their contribution. The resulting best fit central brightness and total magnitudes are shown in Fig. 1 for the Virgo dwaf candidates. It is important to note that the faintest candidates in terms of central brightness are quite extended and not so faint in total magnitude. Thus shallower Virgo surveys could be affected by some incompleteness even at magnitudes significantly brighter than the survey limit. A detailed description of the morphological and spectral characteristics of our sample is beyond the scope of the present work and will be published in a forthcoming paper.
Excluding the three brightest Virgo galaxies of the Markarian chain (NGC 4477, NGC 4479, and NGC 4473), there are eight galaxies shown in Fig. 1 which are present in the Virgo cluster catalogue (VCC), four of which are confirmed Virgo members with spectroscopic redshift (VCC 1307, VCC 1351, VCC 1237, and VCC 1198). Moreover, we have recently obtained spectroscopic follow up for five dwarfs of the G15 sample. Two of them have secure spectroscopic redshifts confirming they are part of the cluster, one has a probable redshift identification, and the remaining two show spectra that are too noisy to derive a redshift (Giallongo et al., in prep.). Thus 26% of the selected Virgo candidates from Fig. 1 are spectroscopically confirmed Virgo members with no exception so far, supporting the reliability of the adopted morphological selection. Therefore, for the analysis described in the next section we consider all the 27 galaxies as bona fide members of the Virgo cluster.
3. Abundance predictions from dark matter scenarios and comparisons with the observed value
The method is based on the drop of the differential sub-halo mass function dφ/dMsh at small masses in DM models where the power spectrum is strongly suppressed with respect to CDM at masses M ≲ 107–109M⊙. As a consequence, the corresponding cumulative sub-halo mass function  saturates to a maximum value
  when the integral is extended down to progressively smaller values of the satellite mass Msh. The strength of the method is that it provides us with a maximum value for the number density of DM halos regardless of the underlying mass- luminosity relation, and, therefore, completely independent of the baryon physics entering galaxy formation.
The computation of the differential sub-halo mass function d φ/ d log Msh in WDM models is based on the standard procedure described and tested against N-body simulations in Schneider et al. (2015) and Schneider (2016; see also Giocoli et al. 2008), derived in the framework of the Extended Press-Schechter approach. This can be expressed as:  (1)The key quantity entering the computations is the linear power spectrum P(k) of DM perturbations, in terms of the wave-number k = 2π/r, where r is the spatial scale of DM density perturbations. Here we have used a sharp-k form (a top-hat sphere in Fourier space) for the window function W(kr) relating the variance to the power spectrum σ2(M) = ∫dkk2P(k) W(kr)/2 π2 at the mass scale
  to the filter scale r (here
  is the background density of the Universe). The factor q is calibrated through simulations; all studies in the literature yield values for q in the range q = 2.5–2.7 (see e.g. Angulo et al. 2013; Benson et al. 2013; Schneider et al. 2013) and we adopt the conservative value q = 2.5. The normalization constant takes the value C = 34 when the host halo is defined as delimited by a density 200 times the critical density inside a halo radius R. With such a definition, present observational uncertainties give for the Virgo cluster Mhh = (4.5−5.5) × 1014M⊙ (McLaughlin 1999; Schindler et al. 1999; Rines & Diaferio 2006; Urban et al. 2011; Durrell et al. 2014; Ferrarese et al. 2012; 2016).
Although Eq. (1) has been tested against N-body simulations only in the case of CDM and thermal WDM models, the Extended Press & Schechter formalism with sharp-k filter on which it is based has been tested against simulations for a much wider set of DM power spectra. Recently Murgia et al. (2017) compared the mass functions computed in the Extended Press & Schechter approach to high-resolution N-body simulations for a wide class of models with suppressed power spectrum compared to CDM, parametrized as to include the power spectra of sterile neutrino DM models (whether resonantly produced or from particle decay), finding a good agreement between the theoretical mass function formalism outlined above and the N-body results. In fact, the above authors applied Eq. (1) to compute the abundance of Milky Way satellites for the above class of DM models.
For thermal WDM and sterile neutrino DM models, with power spectra suppressed at small scales compared to CDM, the differential sub-halo mass functions (Eq. (1)) are characterized by a maximum value at masses close to the “half-mode” mass (see Benson et al. 2013; Schneider et al. 2013; Angulo et al. 2013), the mass scale at which the spectrum is suppressed by 1/2 compared to CDM. This is a strong inverse function of the sterile neutrino mass; for sterile neutrino models it depends also on the assumed lepton asymmetry and, hence, on the resulting mixing angle θ; typical power spectra in such models yield half-mode masses ranging from Mhm ≈ 1010M⊙ to Mhm ≈ 108M⊙. Correspondingly, the cumulative mass functions saturate to a maximum value  , defining the maximum number density of DM halos associated to the considered power spectrum.
For any given power spectrum P(k) – corresponding to a chosen DM model –, the cumulative sub-halo mass function  determines the number of sub-halos with mass larger than Msh within the radius R. The corresponding maximum abundance of satellites within R is
  . This has to be converted in an expected number of galaxies in the observed field, which covers a region of the plane of the sky enclosed between r1 = 310 kpc and r2= 460 kpc from the cluster centre, and extends for 120 kpc in the direction normal to the radius. Thus, the cumulative number of satellite galaxies (projected in the plane of the sky, normal to the line of sight) with mass larger than Msh expected in the observed field for a given DM model is given by
  (2)where Q1 is the fraction of galaxies in the circular region of the plane of the sky between r1 and r2, and Q2 = 1202/ [π (4602−3102)] = 0.04 is the fraction of the circular region covered by our field. The correction factor Q1 depends on the assumed projected density distribution of galaxies in the cluster Σ(r). For the latter we assume the projection given by Lokas & Mamon (2001, Eq. (41)) of a Navarro et al. (1997) profile that is considered to produce an excellent fit for the surface distribution of galaxies in a large sample of clusters when a concentration parameter c = 2.5 is assumed (Budzynski et al. 2012). For the adopted profile, we compute the fraction of galaxies expected within a given projected radius r as F( <
 /
/ . Then the factor Q1 can be estimated as Q1 = F( <r2)−F( <r1), and increases with increasing c and decreasing R. The uncertainties related to the computation of Q1 are discussed in the next section.
Requiring the maximum number of DM satellites expected in a given DM model in the observed field to exceed (or to equal) the observed number of observed satellites φobs corresponds to the following condition:  (3)On considering the statistical uncertainties on φobs and the uncertainties on the density profile parameters (c,R), Eq. (3) allows us to derive constraints on the DM model adopted to compute
  within the proper confidence levels. Our results for WDM and for sterile neutrino DM are presented below.
4. Results: constraining the parameter space of dark matter models
Here we present the constraints that the observed number of Virgo satellites in our field (see Sect. 2) provides for WDM and sterile neutrino DM according to the method described above (Sect. 3). To this aim, we compute the power spectrum P(k) for different regions of the parameter space of WDM and sterile neutrino DM models, and we derive the corresponding satellite distribution after Eq. (1). The corresponding cumulative mass distribution of satellites within our observed field is then derived for each chosen DM model from Eq. (2).
In Eq. (2) we conservatively adopt for the DM mass of the Virgo cluster the value Mhh = 5.5 × 10¹⁴M⊙ (the upper limit of the uncertainty range given in Sect. 3). We note that adopting lower values for Mhh would yield lower sub-halo abundances (see Eq. (1)) thus tightening our constraints. As for the concentration parameter c and radius R of the Virgo cluster, also entering Eq. (2), we perform our analysis taking full account of the present observational uncertainties. As for the former, we shall consider the whole range c = 2–8. In fact, while stacked analysis of a large sample of SDSS clusters shows that on average assuming ⟨ c ⟩ = 2.6 provides an excellent fit to the galaxy distribution inside many clusters (Budzynski et al. 2012), and the analysis in McLaughlin (1999) yields for Virgo c = 2.8 ± 0.7, values up to c = 8 have been reported (Simionescu et al. 2017) in the specific case of the Virgo cluster. For the Virgo radius (defined as the region enclosing an overdensity of 200 with respect to the critical density), we adopt as a baseline the value R = 1.6 Mpc following Ferrarese et al. (2012), but we shall consider the effects on our results of an uncertainty range R = 1–3 Mpc.
For each assumed DM power spectrum P(k), the above uncertainties in the parameters c and R provide an uncertainty range for the projected number density of galaxies expected in the observed field, that we compare (Eq. (3)) with our observed value φobs. To obtain robust constraints, we decrease our measured value (φobs = 27 galaxies, see Sect. 2) by 10% to account for halo-to-halo variance (see e.g. Mao et al. 2015). This yields a conservative central value estimate of φobs = 24.3, with lower bounds φobs = 19.37, φobs = 14.4, and φobs = 9.5 at 1, 2, and 3-σ confidence levels, respectively. Such lower bounds for the observed abundance of galaxies are compared (Eq. (3)) with the expected value computed for different regions of the parameter space of WDM and sterile neutrino DM models, to derive constraints with the corresponding confidence levels.
4.1. Thermal WDM scenario
The only free parameter in such a scenario is the mass mX of the WDM particle. In fact, in this case the power spectrum can be parametrized as (Bode et al. 2001; see also Viel et al. 2005; Destri et al. 2013) ![Mathematical equation: \begin{equation} P_{\rm WDM}(k)=P_{\rm CDM}(k)\,\Big[1+(\alpha\,k)^{2\,\mu}\Big]^{-10/\mu}, \end{equation}](/articles/aa/full_html/2017/08/aa31237-17/aa31237-17-eq118.png) (4)
(4)![Mathematical equation: \begin{eqnarray*} {\rm ~with}~~~~~ \alpha=0.049 \,\left[{\Omega_{\rm X}\over 0.25}\right]^{0.11}\,\left[{m_{\rm X}\over {\rm keV}}\right]^{-1.11}\,\left[{h\over 0.7}\right]^{1.22}\,h^{-1}\,{\rm Mpc}, \end{eqnarray*}](/articles/aa/full_html/2017/08/aa31237-17/aa31237-17-eq119.png) where PCDM is the CDM power spectrum (Bardeen et al. 1986), ΩX = 0.27 is the WDM density parameter, h is the Hubble constant in units of 100 km s-1 Mpc-1, and μ = 1.12. The half-mode mass scale at which the WDM power spectrum is suppressed by 1/2 with respect to CDM is directly related to mX (see Schneider et al. 2012) by the relation
where PCDM is the CDM power spectrum (Bardeen et al. 1986), ΩX = 0.27 is the WDM density parameter, h is the Hubble constant in units of 100 km s-1 Mpc-1, and μ = 1.12. The half-mode mass scale at which the WDM power spectrum is suppressed by 1/2 with respect to CDM is directly related to mX (see Schneider et al. 2012) by the relation ![Mathematical equation: \hbox{$ M_{1/2}=(4\pi/ 3)\,\overline{\rho}\,[\pi\alpha(2^{\mu/5}-1)^{-{1/ 2\mu}}]^{3}$}](/articles/aa/full_html/2017/08/aa31237-17/aa31237-17-eq125.png) , where is the background density of the Universe. For values of thermal relic masses mX = 1.5–4 keV considered here, one obtains M1/2 = 108–109M⊙. As shown by several authors (Schneider et al. 2012; 2013; Angulo et al. 2013; Benson 2013), at this scale the DM mass function saturates and starts to turn off.
, where is the background density of the Universe. For values of thermal relic masses mX = 1.5–4 keV considered here, one obtains M1/2 = 108–109M⊙. As shown by several authors (Schneider et al. 2012; 2013; Angulo et al. 2013; Benson 2013), at this scale the DM mass function saturates and starts to turn off.
The number of sub-halos with mass φ( <Msh) expected in the observed field (Eqs. (1) and (2)) is plotted in Fig. 2 for power spectra corresponding to different WDM thermal relic mass mX, and compared with the observed number (upper horizontal shaded region) corresponding to 24.3 galaxies (central value), 19 galaxies (1−σ deviation), and 14.4 galaxies (2−σ deviation). For each value of mx, the thickness of the lines represents the uncertainty regions associated to profile parameters discussed at the beginning of Sect. 2. For thermal relic masses mX< 2.3 keV, the predicted number of satellites falls below the observed value at 2−σ confidence level, no matter how we extend to consider progressively smaller satellite masses. This is clearly shown in the bottom panel of Fig. 2, where the most conservative value for the maximum abundance of expected halos as a function of the assumed WDM particle mass mX is compared with the observed values (at 1 and 2-σ confidence level).
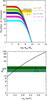 |
Fig. 2 Top panel: the cumulative number of sub-halos with mass φ( <Msh) expected in the observed field for WDM with different thermal relic mass shown in the labels. The thickness of the lines represents the uncertainties in the theoretical predictions related to the uncertainties in the concentration parameter c and in the radius R assuming an uncertainty range 1 ≤ c ≤ 4 and R = 1.5–2 Mpc. The effect of extending the uncertainty ranges of c and R is shown in detail in Fig. 3. The predicted number is compared with the observed values φobs at 1-σ and 2-σ confidence levels, represented by the horizontal shaded regions. Bottom panel: for different values of the thermal relic mass mX, we show the maximum value of the predicted number of DM halos |
Our constraints are slightly tighter than with previous bounds mX ≳ 1.5–2 keV found through the abundance of Milky Way ultra-faint galaxies (e.g. Kennedy et al. 2014; Horiuchi et al. 2014; Lovell et al. 2014; Polisensky & Ricotti 2011), but obtained with observations affected by different systematics. While our constraints are independent of baryon physics, of the assumed luminosity-to-mass ratio of the satellite galaxies, and of their dynamical mass, they are affected by uncertainties in the parameters c and R entering the density profile of the galaxy distribution in the Virgo cluster. However, our constraints on mX are characterized by a slow dependence on such parameters, as shown in Fig. 3. Indeed, increasing c (the parameter most subject to observational uncertainty) up to the value c = 8 will affect our constraints by less than 5%, while assuming values R> 1.6 for the virial radius would lead to even tighter bounds on mX.
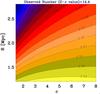 |
Fig. 3 2-σ limits on the thermal relic mass mX (coloured contours) are shown for different assumed values of the concentration parameter c (horizontal axis) and for the cluster radius R (vertical axis) |
In addition, the constraints presented here can be appreciably tightened with aimed observations in the near future. In Fig. 4 we show how the constraints on the thermal WDM particle mass can be improved by increasing the observed value (2-σ confidence level) for different values of the concentration parameter c. This can be achieved either by going deeper (thus increasing the central value φobs), or by enlarging the field area (thus reducing the variance at fixed φobs). For example, doubling the number of observed galaxies at a fixed field area to reach a number of galaxies φobs = 50 (so that at φobs = 35 at 2-σ confidence level) would enable us to constrain WDM models with mX ≈ 3 keV. For a luminosity function steeper than L-1.5, this would require a deepening of about 1.5 mag with respect to the present observations.
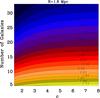 |
Fig. 4 2-σ limits on the thermal relic mass mX (coloured contours) as a function of the observed value φobs (at 2-σ confidence level, vertical axis), assuming for the concentration parameter the different values shown in the x-axis. Here R = 1.6 Mpc is assumed as a reference value. |
4.2. Sterile neutrino DM
In this scenario the power spectrum which appears in Eq. (1) depends not only on the mass mν but also on the production mechanism. Here we shall consider only the production of sterile neutrinos via occasional oscillations from active neutrinos in the early Universe (Dodelson & Widrow 1994; for alternative scenarios based on the decay of scalar particles see Merle & Totzauer 2015, and references therein). In this case, for any given sterile neutrino mass, the mixing angle θ depends on the assumed lepton asymmetry L in the early Universe. In the limit L → 0 (usually referred to as the Dodelson-Widrow limit) the corresponding mixing angles are too large to comply with existing limits from X-ray observations (see e.g. Canetti et al. 2013; Boyarsky et al. 2014; Adhikari et al. 2017). However, in the presence of a significant lepton asymmetry L in the early Universe, sterile neutrino production can be enhanced by a resonance (Shi & Fuller 1999), thus allowing for significantly smaller mixing angles θ which are consistent with present X-ray bounds. Since, for any given sterile neutrino mass, the mixing angle is related to the adopted lepton asymmetry L, in this work we describe the parameter space of sterile neutrino models in terms of combinations of sterile neutrino masses mν and mixing amplitudes sin2(2θ). Each one of such combinations results in a density perturbation power spectrum P(k) which is differently suppressed on small scales compared to CDM. In this work the sterile neutrino momentum distributions for resonant production have been computed with the public code sterile-dm of Venumadhav et al. (2016). To obtain the power spectra, the publicly available Boltzmann solver CLASS (Blas et al. 2011; Lesgourgues & Tram 2011) has been used.
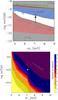 |
Fig. 5 Top panel: constraints on the sterile neutrino parameter space from Eq. (3). The allowed region is the white area. Taking the abundance φobs corresponding to our observed number of galaxies in the target field within 1-σ and 2-σ confidence levels (φobs = 19.3 and φobs = 14.4, respectively) yields the exclusion regions shown as red shaded areas. Our constraints are compared with upper bounds from X-ray observations of the Milky Way and dwarf galaxies (as reported in Riemer-Sørensen 2014). Grey areas are excluded by current limits on the abundance of DM (Ade et al. 2015). The green line corresponds to the non-resonant DW case with vanishing lepton asymmetry L = 0. We also show the constraints obtained from the abundance of satellites in the Milky Way by Schneider (2016, dashed line) and by Lovell et al. (2016, solid line). The tentative line signal at 3.5 keV corresponding to a sterile neutrino mass mν = 7.1 keV (Bulbul et al. 2014; Boyarsky et al. 2014) is shown by the point with errorbars. Bottom panel: the coloured contours correspond to the different values of |
We explore the whole range of free parameters using a grid of values for both mν and sin2(2θ). After computing the corresponding power spectra, the condition  (Eq. (3)) leads to the exclusion region in the plane mν−sin2(2θ) shown in Fig. 5. This is computed for the reference case c = 3 and R = 1.6 Mpc. However, the sensitivity of the curves to changes in such parameters is the same as the thermal WDM case (Fig. 3) so that our constraints change by less than 5% when such parameters are allowed to vary in the range c = 2.4–8 and R = 1–3.
While the non-resonant DW limit L = 0 (the upper green curve in the top panel of Fig. 5) is excluded by X-ray observations, lower values of sin2(2θ) are consistent with the X-ray observations and – at the same time – yields a number of sub-halos large enough to be consistent with the observed values φobs, thus resulting into the allowed region of Fig. 5. When the lepton number further increases, that is, for even smaller values of sin2(2θ), warmer power spectra are obtained, thus yielding the lower exclusion region.
We note that our observations lead to a mass limit of mν ≥ 5 keV for the sterile neutrino independently of the mixing angle. For larger masses, the measured number of galaxies in our target field yields strong lower limits for the allowed range of sin2(2θ). In particular, for neutrino masses mν = 7 keV our observations allow a region log sin2(2θ) ≥ −10.2; interestingly, the tentative 3.5 keV line signal reported in several works based on X-ray observations (Cappelluti et al. 2017; Bulbul et al. 2014; Boyarsky et al. 2014j; Sekiya et al. 2015; Jeltema & Profumo 2015; Riemer-Sørensen 2016; Adhikari et al. 2016) falls within the range allowed by our results and by existing upper X-ray bounds. We also show the bounds on the sin2(2θ)−mν plane obtained from the abundance of ultra-faint Milky Way satellites by Schneider (2016) and Lovell et al. (2016). Our results match almost perfectly those in Schneider (2016). This is particularly interesting, since the constraints from Milky Way satellites have been obtained through methods subject to different systematics compared to our analysis, which include assumed lower limits for the satellite mass (obtained either through the luminosity-to-mass ratio or the measurement of stellar velocity dispersions). On the other hand, Milky Way constraints based on satellite abundances computed through a semi-analytic computation (Lovell et al. 2016) found somewhat looser limits.
Finally, in the bottom panel of Fig. 5 we show the full distribution of the expected number of galaxies in the target field corresponding to each combination of sin2(2θ)−mν. This can be used as a guideline for future observations, since measuring abundances of satellite galaxies  would correspond to probing the portion of the sin2(2θ)−mν plane marked by the corresponding contour. For example, observing a number φobs = 50 galaxies in our field would lead to probing of the parameter space deep within the present errorbar of the tentative 3.5 kev line.
5. Conclusions
We have extended our previous sample of low surface brightness galaxies in the Virgo cluster measuring a total number of φobs = 27 galaxies in a narrow field of ~0.17 deg2 located at a median distance of 390 kpc from the cluster centre. We have shown that the corresponding total galaxy population of satellite galaxies in the Virgo cluster provides strong constraints on DM models with suppressed power spectra compared to CDM. In particular, requiring the total number of satellite galaxies in the Virgo cluster not to exceed the maximum number of DM sub-halos provides limits mX ≥ 2.3 keV (at 2-σ confidence level) for thermal WDM models, and provides robust lower limits on the mixing parameter sin2(2θ) of sterile neutrino DM models for each value of the sterile neutrino mass mν. In particular, for DM models with sterile neutrino masses mν = 7 keV (those possibly associated to the tentative 3.5 keV line), our observations yield a lower limit log sin2(2θ) ≥ −10.2. The above limits can be translated into bounds on the lepton asymmetry  , defined in terms of the difference in electron neutrino and anti electron neutrino abundance divided by the entropy density. For a given mass mν, this is inversely related to the mixing parameter (see e.g. Fig. 1 in Lovell et al. 2015; Boyarsky et al. 2009, and references therein). For example, for sterile neutrinos with mass mν = 7 keV our constraints on the mixing parameter correspond to L6 ≤ 10.
We have shown that such bounds are independent of baryon physics entering galaxy formation. Indeed, our results do not require any measurement of the properties of the dwarf galaxies (like their DM or stellar mass, their luminosity or colours, or their luminosity distributions) but only rely on the observed abundance of satellite dwarfs in the target field. Indeed, while we performed a detailed investigation of the robustness of our results with respect to the statistical uncertainties and to the systematics affecting the measured dwarf satellite abundance, we postpone a detailed investigation of the stellar and luminous properties of such galaxies to a future paper.
On the other hand, our bounds on the WDM and sterile neutrino DM models are competitive with existing limits from the abundance of Milky Way satellites, and with those arising from the abundance of faint galaxies at z = 6–7 detected in the HFF program. This is particularly important since the consistency in bounds derived from observations involving completely different scales of host halo mass (in the case of Milky Way satellites) or of cosmic times (in the case of high-redshift galaxies) shows a convergence of existing limits on DM from cosmic structures to the same values (mX ≳ 2.5 keV for thermal WDM particles). This is even more noticeable when one considers the completely different systematics that affect the various methods. In fact, limits derived from the abundance of Milky Way satellites are affected by assumptions concerning their spatial distributions, by measurements used to derive their DM mass, and by the assumed mass of the Milky Way; systematics affecting the bounds derived from the abundance of high-redshift are related to the magnification of such objects and to the assumed size-luminosity relation (Bouwens et al. 2017a); and the abundance of satellites of the Virgo cluster presented in this paper depends on an assumed galaxy spatial distribution as described in Sects. 3 and 4. Nevertheless, when such aspects are properly addressed, all methods converge to provide similar constraints on the parameter space of DM models. In the case of sterile neutrino DM, it is also noticeable that all methods yield bounds that are consistent with the decay origin of the tentative 3.5 keV line in the X-ray spectra of different objects.
We stress that the bounds on the DM properties based on the abundance of dwarf satellites in the Virgo cluster presented in this paper are easier to be significantly improved compared to other constraints based on the abundance of dwarf galaxies. In fact, at present, uncertainties in the magnification and sizes limit the improvement of bounds from faint, high-redshift galaxies, while the detection of very diffuse structures like ultra-faint dwarfs in the Milky Way will be very challenging due to contamination by foreground stars, and will involve very deep observations over significantly large portions of the sky, a task that will require LSST (which will observe half of the sky down to r ~ 27 approximately by the year 2028, see Ivezic et al. 2016). Instead, deeper observations of the galaxies in the Virgo cluster have the potentiality to improve rapidly to reach unprecedented baryon-independent constraints on the mass of thermal WDM particles and on sterile neutrino DM models.
In fact, such a potentiality is witnessed by the improvement of the new observations in the present paper with respect to the results reported in Giallongo et al. (2015) and originates from the combined increase in the detection threshold of both magnitude and surface brightness. Indeed, inspection of Fig. 1 shows that new LSB galaxies have been found both at r > 22 and at μr > 26. This shows that tighter limits can be achieved with reasonable efforts in future LBT observations of the Virgo cluster by combining deeper observations with larger areas. For example, covering four LBC field-of-view to reach a 2σ fluctuation in background surface brightness of the order of ~30 mag arcsec-2 would require approximately 120 h with LBT in the next two to three years. If the Virgo luminosity function extends 1.5 mag fainter with the same faint-end slope ≃−1.4, this will allow us to find approximatively ~50 dwarfs (with a central surface brightness ≲28.5 mag arcsec-2) within a 0.15 deg2 area, with half the present variance. This would yield a lower bound φobs ≥ 50–7 = 43 at 2σ confidence level. This (if the presence of fainter galaxies is confirmed by future observations) would allow us to exclude at 95.4% confidence level (i.e. 2σ) the value mX ≈ 3.3 keV (see Fig. 2, bottom panel) for the thermal relic case (comparable to that set by the Lyman-α forest, but independent of baryon physics), and would restrict the allowed range of values for the mixing angle of sterile neutrino models to an unprecedented narrow region (see Fig. 5, bottom panel), so as to probe the region consistent with the tentative 3.5 keV line.
It is interesting to note that this programme can be executed only with wide field instruments at 8–10 m class telescopes. For comparison, the James Webb space telescope, thanks to the low background from space, will reach deeper magnitudes but will cover significantly smaller areas of the sky, so it will not be able to carry out such a survey, although it will improve the limits from ultra-faint, strongly-lensed, high-redshift galaxies (see Menci et al. 2017).
Acknowledgments
Observations have been obtained using the Large Binocular Telescope at Mt. Graham, AZ. The LBT is an international collaboration among institutions in the United States, Italy, and Germany. LBT Corporation partners are The University of Arizona on behalf of the Arizona university system; Istituto Nazionale di Astrofisica, Italy; LBT Beteiligungsgesellschaft, Germany, representing the Max-Planck Society, the Astrophysical Institute Potsdam, and Heidelberg University; Ohio State University; and The Research Corporation, on behalf of The University of Notre Dame, University of Minnesota, and University of Virginia.
References
- Abazajian, K. N., Calabrese, E., Cooray, A., et al. 2011, Astropart. Phys., 35, 177 [NASA ADS] [CrossRef] [Google Scholar]
- Adhikari, R., Agostini, M., Ky, N. A., et al. 2017, JCAP, 01, 025 [Google Scholar]
- Angulo, R. E., Hahn, O., Abel, T. 2013, MNRAS, 434, 3337 [NASA ADS] [CrossRef] [Google Scholar]
- Baur, J., Palanque-Delabrouille, N., Yèche, C., et al. 2017, JCAP, submitted [arXiv:1706.03118] [Google Scholar]
- Benson, A. J. 2013, MNRAS, 428, 1774 [NASA ADS] [CrossRef] [Google Scholar]
- Benson, A. J., Lacey, C. G., Baugh, C. M., Cole, S., Frenk, C. S. 2002, MNRAS, 333, 156 [NASA ADS] [CrossRef] [Google Scholar]
- Bertin, E., & Arnouts, S. 1996, A&AS, 117, 393 [NASA ADS] [CrossRef] [EDP Sciences] [Google Scholar]
- Blas, D., Lesgourgues, J., & Tram, T. 2011, JCAP, 1107, 034 [NASA ADS] [CrossRef] [Google Scholar]
- Bode, P., Ostriker, J. P., & Turok, N. 2001, ApJ, 556, 93 [NASA ADS] [CrossRef] [Google Scholar]
- Bouwens, R. J., Oesch, P. A., Illingworth, G. D., Ellis, R. S., & Stefanon, M. 2017a, ApJ, 843, 129 [NASA ADS] [CrossRef] [Google Scholar]
- Bouwens, R. J., Illingworth, G. D., Oesch, P. A., Atek, H., Lam, D., Stefanon, M. 2017b, ApJ, 843, 41 [NASA ADS] [CrossRef] [Google Scholar]
- Boyarsky, A., Ruchayskiy, O., Shaposhnikov, M. 2009, Ann. Rev. Nucl. Part. Sci., 59, 191 [NASA ADS] [CrossRef] [Google Scholar]
- Boyarsky, A., Ruchayskiy, O., Iakubovskyi, D., & Franse, J. 2014, Phys. Rev. Lett., 113, 251301 [NASA ADS] [CrossRef] [PubMed] [Google Scholar]
- Budzynski, J. M., Koposov, S. E., McCarthy, I. G., McGee, S. L., & Belokurov, V. 2012, MNRAS, 423, 104 [NASA ADS] [CrossRef] [Google Scholar]
- Bulbul, E., Markevitch, M., Foster, A., Smith, R. K., Loewenstein, M., & Randall, S. W. 2014, ApJ, 789, 13 [NASA ADS] [CrossRef] [Google Scholar]
- Bullock, J. S., Kravtsov, A. V., & Weinberg, D. H. 2000, ApJ, 539, 517 [NASA ADS] [CrossRef] [Google Scholar]
- Canetti, L., Drewes, M., Frossard, T., & Shaposhnikov, M. 2013, Phys. Rev. D, 87, 093006 [NASA ADS] [CrossRef] [Google Scholar]
- Colombi, S., Dodelson, S., & Widrow, L. M. 1996, ApJ, 458, 1 [NASA ADS] [CrossRef] [Google Scholar]
- Conselice, C. J., Gallagher, J. S., & Wyse, R. F. G. 2002, AJ, 123, 2246 [NASA ADS] [CrossRef] [Google Scholar]
- Corasaniti, P. S., Agarwal, S., Marsh, D. J. E., & Das, S. 2017, Phys. Rev. D, 95, 083512 [NASA ADS] [CrossRef] [Google Scholar]
- Davies, J. I., Davies, L. J. M., & Keenan, O. C. 2016, MNRAS, 456, 1607 [NASA ADS] [CrossRef] [Google Scholar]
- de Vega, H. J., & Sanchez, N. G. 2010, MNRAS, 404, 885 [NASA ADS] [CrossRef] [Google Scholar]
- Destri, C., de Vega, P., & Sanchez, N. G. 2013, Phys. Rev. D, 88, 3512 [CrossRef] [Google Scholar]
- Diemand, J., Kuhlen, M., Madau, P., et al. 2008, Nature, 454, 735 [NASA ADS] [CrossRef] [PubMed] [Google Scholar]
- Dodelson, S., & Widrow, L. M. 1994, Phys. Rev. Lett., 72, 17 [NASA ADS] [CrossRef] [PubMed] [Google Scholar]
- Ferrarese, F., Cote, P., Cuillandre, J. C., et al. 2012, ApJS, 200, 4 [NASA ADS] [CrossRef] [Google Scholar]
- Ferrarese, L., Cote, P., Sánchez-Janssen, R., Roediger, J., et al. 2016, ApJ, 824, 10 [NASA ADS] [CrossRef] [Google Scholar]
- Ferrero, I., Abadi, M. G., Navarro, J. F., Sales, L. V., & Gurovich, S. 2012, MNRAS, 425, 2817 [Google Scholar]
- Garzilli, A., Boyarsky, A., & Ruchayskiy, O. 2015, [arXiv:1510.07006] [Google Scholar]
- Giallongo, E., Ragazzoni, R., Grazian, A., et al. 2008, A&A, 482, 349 [NASA ADS] [CrossRef] [EDP Sciences] [Google Scholar]
- Giallongo, E., Menci, N., Grazian, A., et al. 2015, ApJ, 813, 68 (G15) [NASA ADS] [CrossRef] [Google Scholar]
- Giocoli, C., Pieri, L., & Tormen, G. 2008, MNRAS, 387, 689 [NASA ADS] [CrossRef] [Google Scholar]
- Grazian, A., Castellano, M., Koekemoer, A. M., et al. 2011, A&A, 532, A33 [NASA ADS] [CrossRef] [EDP Sciences] [Google Scholar]
- Horiuchi, S., Humphrey, P. J., Onorbe, J., et al. 2014, Phys. Rev. D, 89, 025017 [NASA ADS] [CrossRef] [MathSciNet] [Google Scholar]
- Iršič, V., Viel, M., & Berg, T. A. M. 2017, MNRAS, 466, 4332 [NASA ADS] [Google Scholar]
- Ivezic, Z., Connolly, A. J., & Juric, M. 2016, Astroinformatics, IAU Symp., 325, 93 [NASA ADS] [CrossRef] [Google Scholar]
- Jeltema, T. E., & Profumo, S. 2016, MNRAS, 458, 3592 [NASA ADS] [CrossRef] [Google Scholar]
- Kennedy, R., Frenk, C., Cole, S., & Benson, A. 2014, MNRAS, 442, 2487 [NASA ADS] [CrossRef] [Google Scholar]
- Klypin, A. A., Kravtsov, A. V., Valenzuela, O., & Prada, F. 1999, ApJ, 522, 82 [Google Scholar]
- Lapi, A., & Danese, L. 2015, JCAP, 1509, 003 [NASA ADS] [CrossRef] [Google Scholar]
- Lerchster, M., Seitz, S., Brimioulle, F., et al. 2011, MNRAS, 411, 2667 [NASA ADS] [CrossRef] [Google Scholar]
- Lesgourgues, J., & Tram, T. 2011, JCAP, 1109, 032 [NASA ADS] [CrossRef] [Google Scholar]
- Livermore, R. C., Finkelstein, S. L., & Lotz, J. M. 2017, ApJ, 835, 113 [NASA ADS] [CrossRef] [Google Scholar]
- Lovell, M. R., Frenk, C. S., Eke, V. R., et al. 2014, MNRAS, 439, 300 [NASA ADS] [CrossRef] [Google Scholar]
- Lovell, M. R., Bose, S., Boyarsky, A., et al. 2016, MNRAS, 461, 60 [NASA ADS] [CrossRef] [Google Scholar]
- Mao, Y.-Y., Williamson, M., Wechsler, R. H. 2015, ApJ, 810, 21 [NASA ADS] [CrossRef] [Google Scholar]
- McLaughlin, D. E. 1999, ApJ, 512, L1 [Google Scholar]
- Mei, S., Blakeslee, J. P., & Cote, P., et al. 2007, ApJ, 655, 144 [NASA ADS] [CrossRef] [Google Scholar]
- Menci, N., Sanchez, N. G., Castellano, M., & Grazian, A., 2016a, ApJ, 818, 90 [NASA ADS] [CrossRef] [Google Scholar]
- Menci, N., Grazian, A., Castellano, M., & Sanchez, N. G. 2016b, ApJ, 825, L1 [NASA ADS] [CrossRef] [Google Scholar]
- Merle, A., & Totzauer, M. 2015, JCAP, 1506, 011 [NASA ADS] [CrossRef] [Google Scholar]
- Murgia, R., Merle, A., Viel, M., Totzauer, M., & Schneider, A. 2017, ArXiv e-prints [arXiv:1704.07838] [Google Scholar]
- Navarro, J. F., Frenk, C. S., & White, S. D. M. 1997, ApJ, 490, 493 [NASA ADS] [CrossRef] [Google Scholar]
- Pacucci, F., Mesinger, A., & Haiman, Z. 2013, MNRAS, 435, L53 [NASA ADS] [CrossRef] [Google Scholar]
- Peng, C. Y., Ho, L. C., Impey, C. D., & Rix, H.-W. 2010, AJ, 139, 2097 [NASA ADS] [CrossRef] [Google Scholar]
- Polisensky, E., & Ricotti, M. 2011, Phys. Rev. D, 83, 043506 [NASA ADS] [CrossRef] [Google Scholar]
- Riemer-Sørensen, S. 2016, A&A, 590, A71 [NASA ADS] [CrossRef] [EDP Sciences] [Google Scholar]
- Rines, K., & Diaferio, A. 2006, AJ, 132, 1275 [NASA ADS] [CrossRef] [Google Scholar]
- Rines, K., & Geller, M. J. 2008, AJ, 135, 1837 [NASA ADS] [CrossRef] [Google Scholar]
- Sabatini, S., Davis, J., Scaramella, R., et al. 2003, MNRAS, 341 [Google Scholar]
- Sawala, T., Frenk, C. S., Fattahi, A., et al. 2016, MNRAS, 456, 85 [NASA ADS] [CrossRef] [Google Scholar]
- Schneider, A. 2015, MNRAS, 451, 3117 [NASA ADS] [CrossRef] [Google Scholar]
- Schneider, A. 2016, JCAP, 1604, 059 [NASA ADS] [CrossRef] [Google Scholar]
- Schneider, A., Smith, R. E., Maccio, A. V., & Moore, B. 2012, MNRAS, 424, 684 [NASA ADS] [CrossRef] [Google Scholar]
- Schneider, A., Smith, R. E., & Reed, D. 2013, MNRAS, 433, 1573 [NASA ADS] [CrossRef] [Google Scholar]
- Schneider, A., Trujillo-Gomez, S., Papastergis, E., Reed, D., & Lake, G. 2017, MNRAS, 470, 1542 [NASA ADS] [CrossRef] [Google Scholar]
- Schindler, S., Binggeli, B., & Böhringer 1999, A&A, 343, 420 [NASA ADS] [Google Scholar]
- Schultz, C., Onorbe, J., Abazajian, K. N., & Bullock, J. S. 2014, MNRAS, 442, 1597 [NASA ADS] [CrossRef] [Google Scholar]
- Sekiya, N., Yamasaki, N. Y., & Mitsuda, K. 2015, PASJ, 68, S31 [Google Scholar]
- Shi, X. D., & Fuller, G. M. 1999, Phys. Rev. Lett., 82, 2832 [NASA ADS] [CrossRef] [Google Scholar]
- Simionescu, A., Werner, N., Mantz, A., Allen, S. W., & Urban, O. 2017, MNRAS, 469, 1476 [NASA ADS] [CrossRef] [Google Scholar]
- Somerville, R. S. 2002, ApJ, 572, L23 [NASA ADS] [CrossRef] [Google Scholar]
- Springel, V., Wang, J., Vogelsberger, M., et al. 2008, MNRAS, 391, 1685 [NASA ADS] [CrossRef] [Google Scholar]
- Urban, O., Werner, N., Simionescu, A., Allen, S. W., & Böhringer, H. 2011, MNRAS, 414, 2101 [NASA ADS] [CrossRef] [Google Scholar]
- Venumadhav, T., Cyr-Racine, F.-Y., Abazajian, K. N., & Hirata, C. M. 2016, Phys. Rev. D, 94, 043515 [NASA ADS] [CrossRef] [Google Scholar]
- Viel, M., Lesgourgues, J., Haehnelt, M. G., Matarrese, S., & Riotto, A. 2005, Phys. Rev. D, 71, 063534 [NASA ADS] [CrossRef] [Google Scholar]
- Viel, M., Becker, G. D., Bolton, J. S., & Haehnelt, M. G. 2013, Phys. Rev. D, 88, 043502 [NASA ADS] [CrossRef] [Google Scholar]
All Figures
|
Fig. 1 Top panel: finding chart of our field around the bright galaxy NGC 4477. The area is 0.17 deg2. The image reaches a 2σ fluctuation in background surface brightness of the order of ~28.6 mag arcsec-2. Bottom panel: central surface brightness versus total Gunn-r magnitudes. The straight line represents the best fit of the correlation shown by the background galaxies (black points). Circles are LSB candidates selected in Paper I (after zeropoint correction by −0.1 mag). Red large squares are new VIRGO candidates selected from the present catalogue. |
| In the text | |
|
Fig. 2 Top panel: the cumulative number of sub-halos with mass φ( <Msh) expected in the observed field for WDM with different thermal relic mass shown in the labels. The thickness of the lines represents the uncertainties in the theoretical predictions related to the uncertainties in the concentration parameter c and in the radius R assuming an uncertainty range 1 ≤ c ≤ 4 and R = 1.5–2 Mpc. The effect of extending the uncertainty ranges of c and R is shown in detail in Fig. 3. The predicted number is compared with the observed values φobs at 1-σ and 2-σ confidence levels, represented by the horizontal shaded regions. Bottom panel: for different values of the thermal relic mass mX, we show the maximum value of the predicted number of DM halos |
| In the text | |
|
Fig. 3 2-σ limits on the thermal relic mass mX (coloured contours) are shown for different assumed values of the concentration parameter c (horizontal axis) and for the cluster radius R (vertical axis) |
| In the text | |
|
Fig. 4 2-σ limits on the thermal relic mass mX (coloured contours) as a function of the observed value φobs (at 2-σ confidence level, vertical axis), assuming for the concentration parameter the different values shown in the x-axis. Here R = 1.6 Mpc is assumed as a reference value. |
| In the text | |
|
Fig. 5 Top panel: constraints on the sterile neutrino parameter space from Eq. (3). The allowed region is the white area. Taking the abundance φobs corresponding to our observed number of galaxies in the target field within 1-σ and 2-σ confidence levels (φobs = 19.3 and φobs = 14.4, respectively) yields the exclusion regions shown as red shaded areas. Our constraints are compared with upper bounds from X-ray observations of the Milky Way and dwarf galaxies (as reported in Riemer-Sørensen 2014). Grey areas are excluded by current limits on the abundance of DM (Ade et al. 2015). The green line corresponds to the non-resonant DW case with vanishing lepton asymmetry L = 0. We also show the constraints obtained from the abundance of satellites in the Milky Way by Schneider (2016, dashed line) and by Lovell et al. (2016, solid line). The tentative line signal at 3.5 keV corresponding to a sterile neutrino mass mν = 7.1 keV (Bulbul et al. 2014; Boyarsky et al. 2014) is shown by the point with errorbars. Bottom panel: the coloured contours correspond to the different values of |
| In the text | |
Current usage metrics show cumulative count of Article Views (full-text article views including HTML views, PDF and ePub downloads, according to the available data) and Abstracts Views on Vision4Press platform.
Data correspond to usage on the plateform after 2015. The current usage metrics is available 48-96 hours after online publication and is updated daily on week days.
Initial download of the metrics may take a while.