Fig. 2
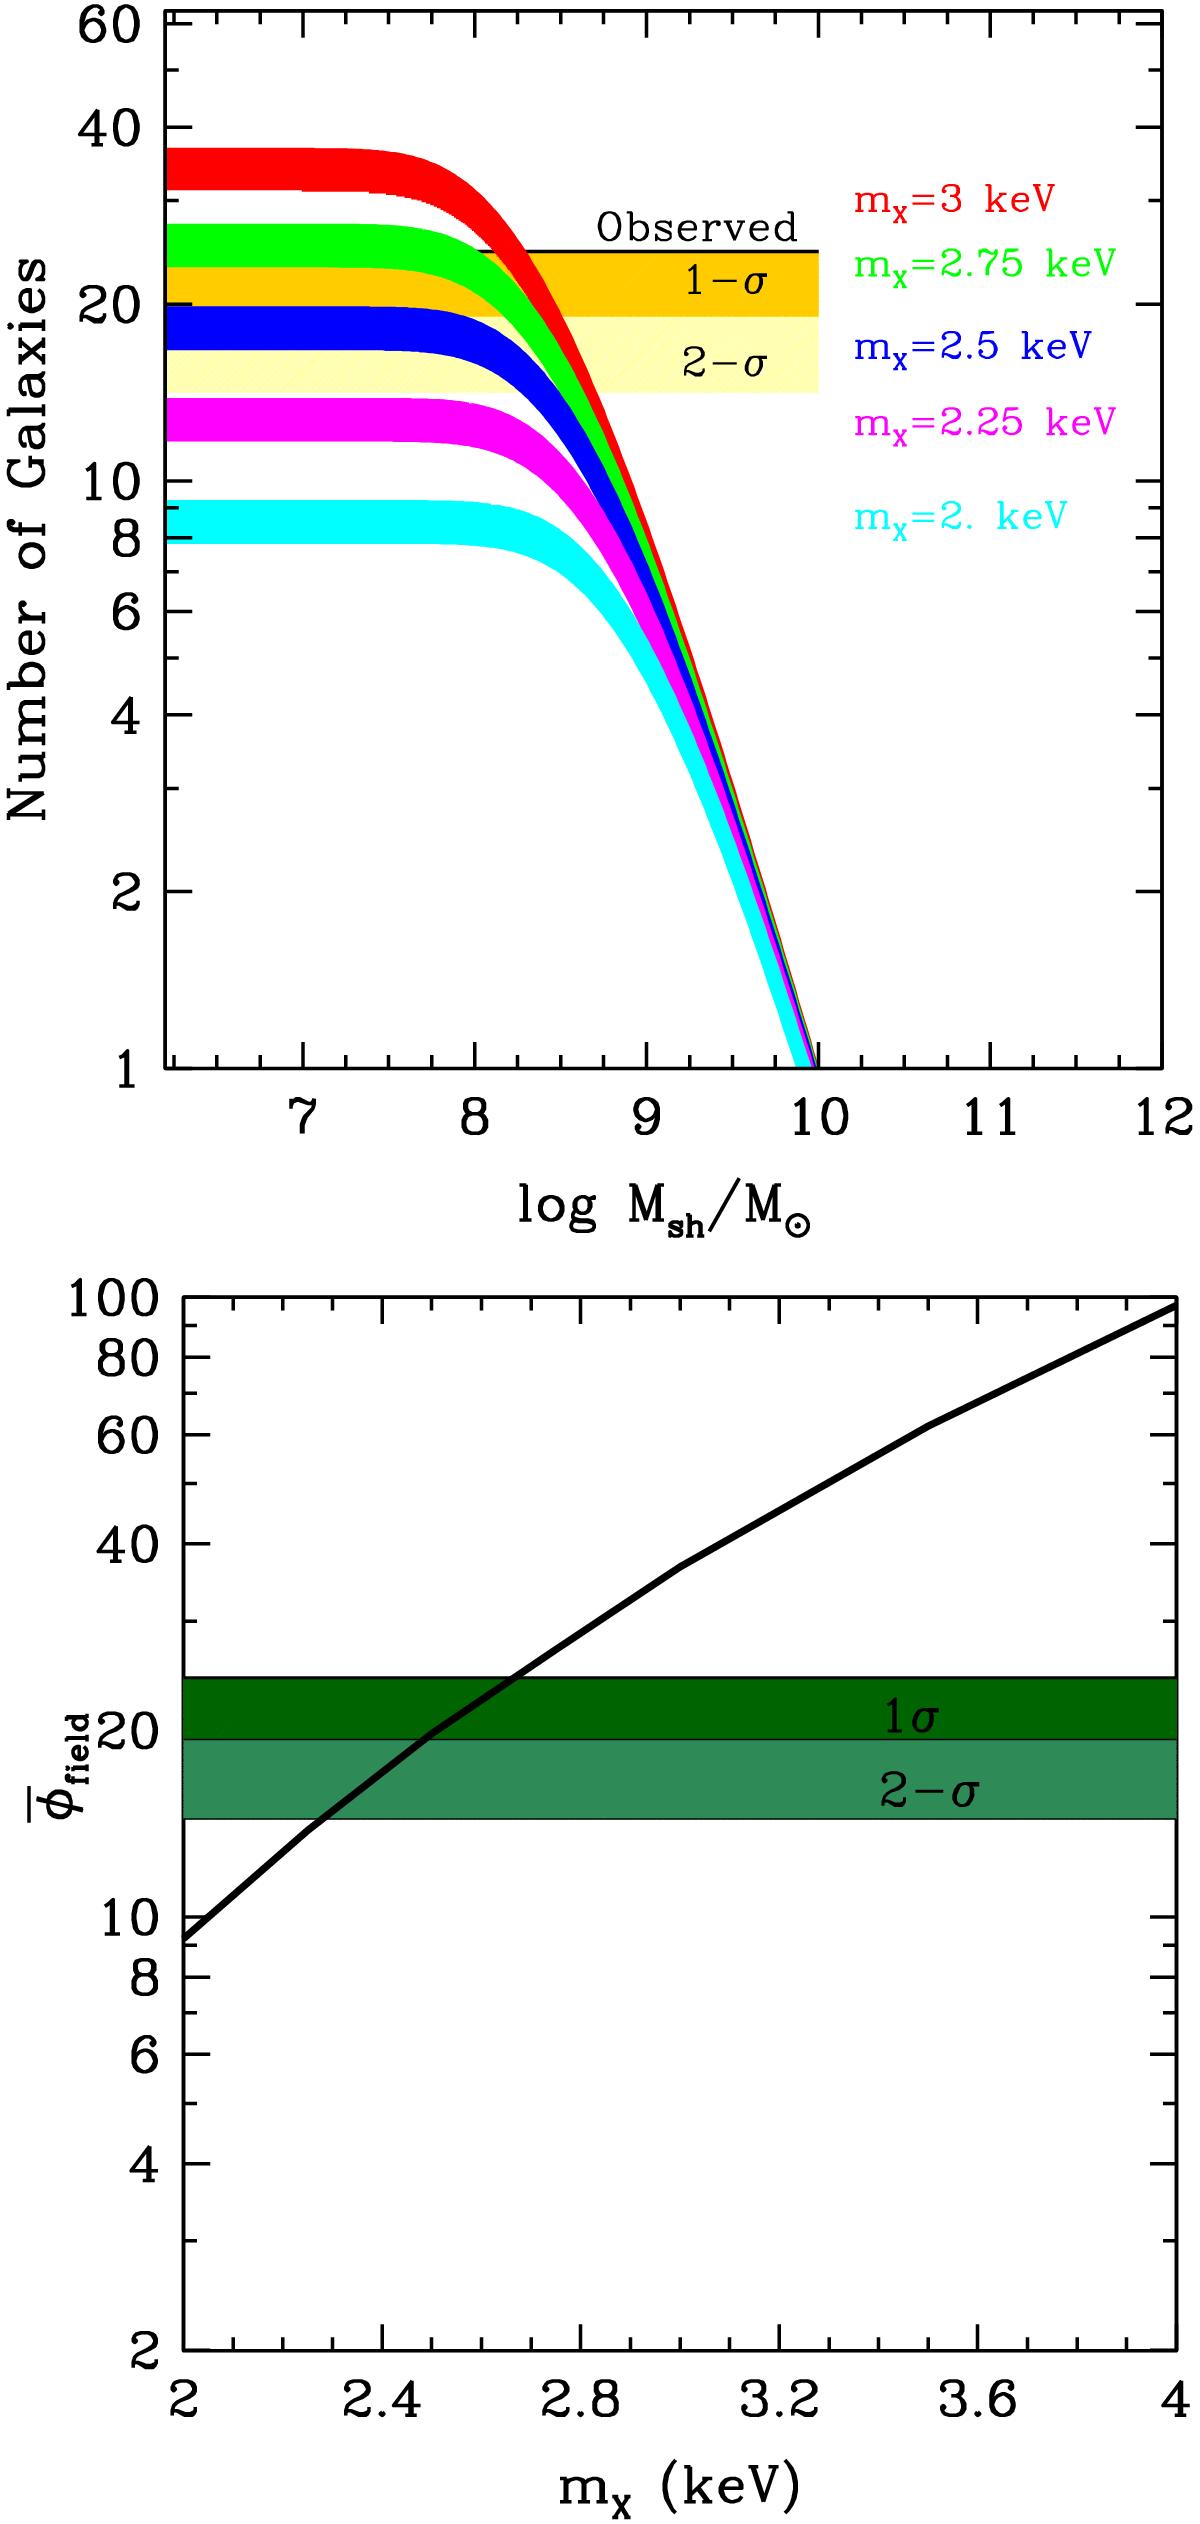
Top panel: the cumulative number of sub-halos with mass φ( <Msh) expected in the observed field for WDM with different thermal relic mass shown in the labels. The thickness of the lines represents the uncertainties in the theoretical predictions related to the uncertainties in the concentration parameter c and in the radius R assuming an uncertainty range 1 ≤ c ≤ 4 and R = 1.5–2 Mpc. The effect of extending the uncertainty ranges of c and R is shown in detail in Fig. 3. The predicted number is compared with the observed values φobs at 1-σ and 2-σ confidence levels, represented by the horizontal shaded regions. Bottom panel: for different values of the thermal relic mass mX, we show the maximum value of the predicted number of DM halos ![]() in the observed field, and compare it with the observed number within 1-σ and 2-σ confidence levels.
in the observed field, and compare it with the observed number within 1-σ and 2-σ confidence levels.
Current usage metrics show cumulative count of Article Views (full-text article views including HTML views, PDF and ePub downloads, according to the available data) and Abstracts Views on Vision4Press platform.
Data correspond to usage on the plateform after 2015. The current usage metrics is available 48-96 hours after online publication and is updated daily on week days.
Initial download of the metrics may take a while.