Fig. 2
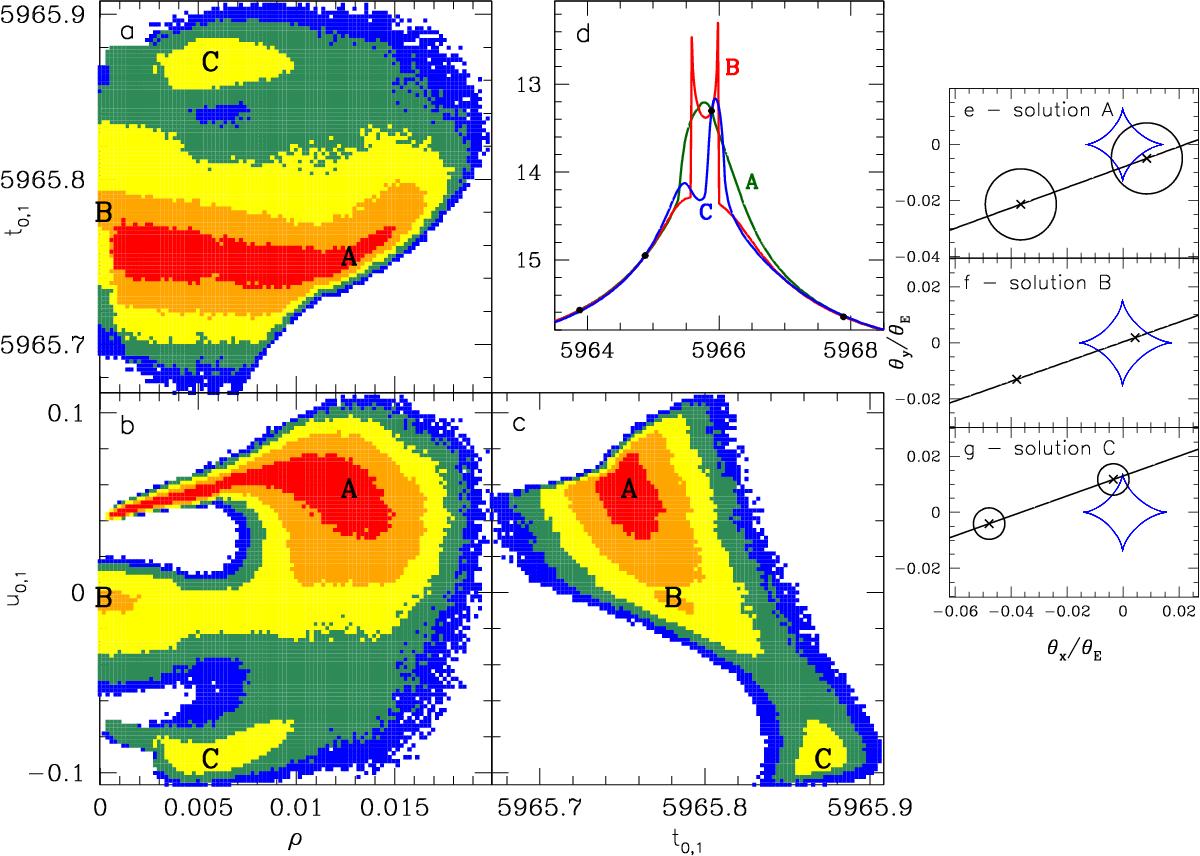
Degenerate solutions for MOA-2012-BLG-006. Top center panel d) presents anomaly part of light curves for three modes A, B, and C. All three light curves predict the second subevent at HJD′ = 6047. Remaining large panels a)–c) show the projection of the marginalized χ2 hypersurface. Red, orange, yellow, green, and blue points correspond to Δχ2 of <1, <4, <9, <16, and <25, respectively. Letters A, B, and C mark the three modes. We note that u0,1> 0 means that the companion and the host caustics are passed on opposite sides. The data presented on this plot are not the result of a single run, but a compilation of many simulations and were obtained using OGLE data only. Similar plot for OGLE and MOA data does not show significant differences except different levels of Δχ2. In particular, MOA data at HJD′ = 5965.2 and 5967.2 significantly contribute to preference of mode A over mode C. The small panels on the right e)–g) show source trajectories of the three solutions relative to planetary caustic (blue curve). Crosses mark the source positions at epochs when OGLE data were taken. Circles have a radius of ρ. In the case of solution B, the source size of ρ = 0.00016 is too small to be seen.
Current usage metrics show cumulative count of Article Views (full-text article views including HTML views, PDF and ePub downloads, according to the available data) and Abstracts Views on Vision4Press platform.
Data correspond to usage on the plateform after 2015. The current usage metrics is available 48-96 hours after online publication and is updated daily on week days.
Initial download of the metrics may take a while.