Fig. 7
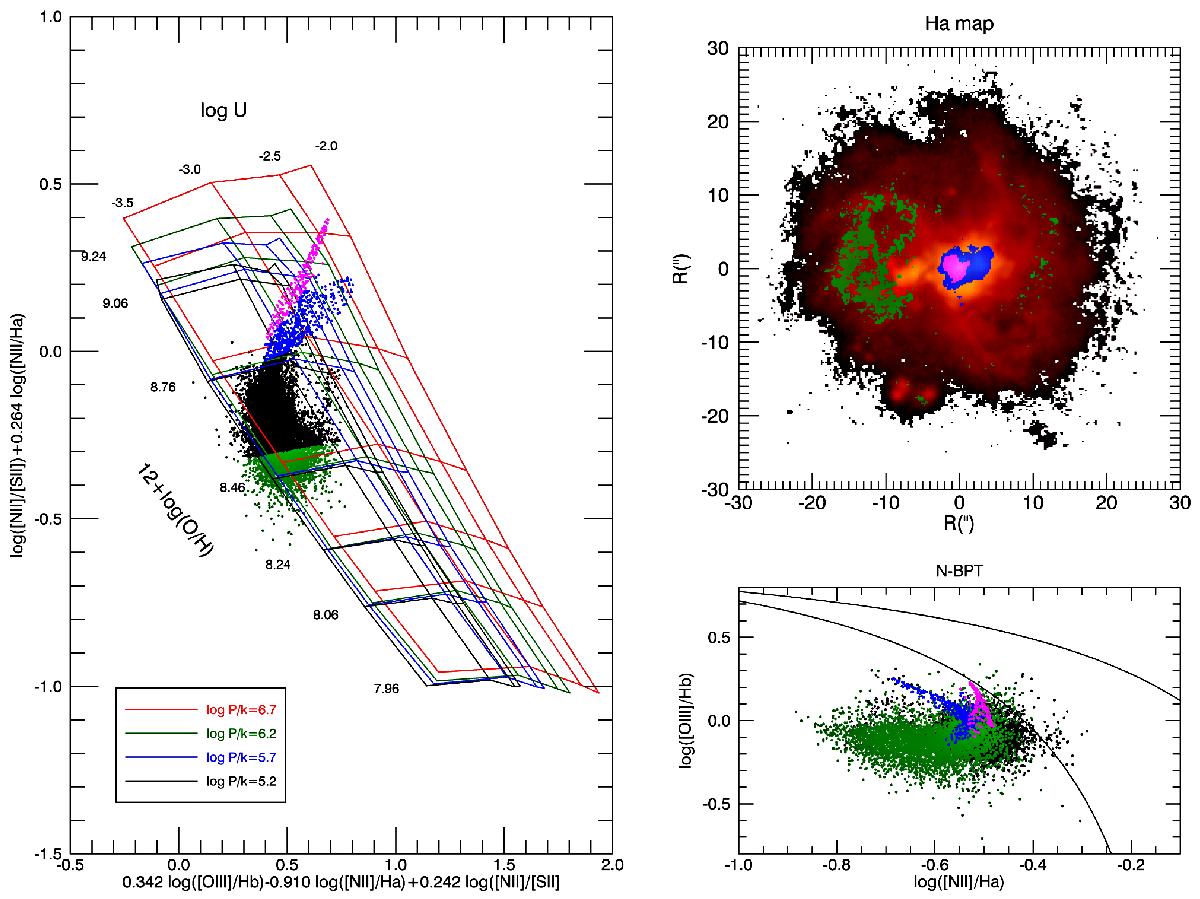
Spatially resolved emission line diagnostic by Dopita et al. (2016) for spaxels in He 2-10 with S/N> 3 in all the emission lines involved. The diagnostic diagram is shown in the left panel, where each point correspond to a MUSE spaxel. The metallicity scale, which increases toward the upper side of the plot, and ionization parameter scale, which increases toward the right side of the plot, are shown on the different grids, corresponding to different values of the ISM pressure. The spaxels whose metallicity in the Dopita et al. (2016) scale is lower than 12 + log (O / H) = 8.5 are indicated in green, while the two horn-like structures at high metallicity and ionization parameter are shown in magenta and blue. These regions are indicated with the same color in the upper right panel overplotted on the Hα map of the galaxy: the high metallicity and ionization parameter regions correspond to the highly star forming clusters, while the low metallicity region of the galaxy is mostly in the western part. The lower right panel shows the position of the regions selected on the diagnostic diagram on the N-BPT.
Current usage metrics show cumulative count of Article Views (full-text article views including HTML views, PDF and ePub downloads, according to the available data) and Abstracts Views on Vision4Press platform.
Data correspond to usage on the plateform after 2015. The current usage metrics is available 48-96 hours after online publication and is updated daily on week days.
Initial download of the metrics may take a while.