Fig. 6
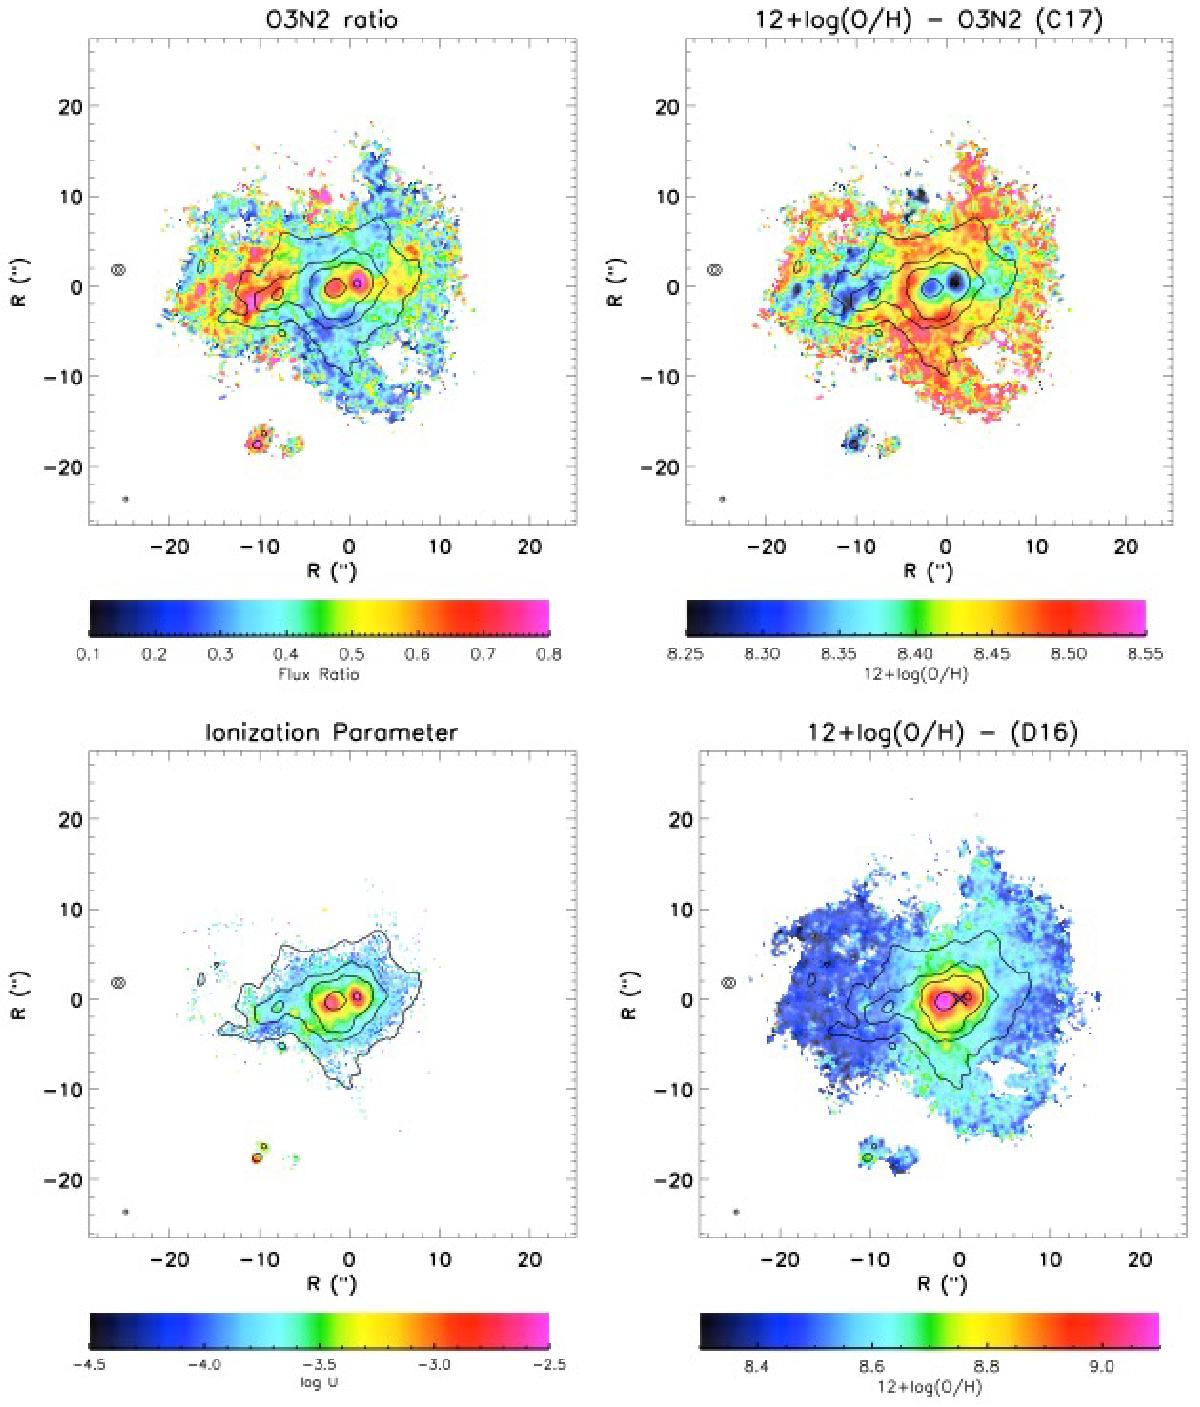
Spatial dependence of the O3N2 line ratio ([OIII]λ5007/Hβ·Hα/[NII]λ6584, upper left panel), derived metallicity (from O3N2, following Curti et al. (2017) calibrations, upper right panel), ionization parameter U from the [SIII]λ9069/[SII]λ6716, 30 line ratio (lower left panel) and the metallicity map using the diagnostic by Dopita et al. (2016) (lower right panel). The central regions appear to have higher O3N2 and therefore lower metallicity according to single line ratio diagnostics such as O3N2, but the ionization parameter is one order of magnitude higher than the outer regions of the galaxy. The diagnostic by Dopita et al. (2016) actually predict higher metallicity in those regions and a much larger metallicity gradient. All maps indicate the spaxels with S/N> 3 in all the emission lines involved.
Current usage metrics show cumulative count of Article Views (full-text article views including HTML views, PDF and ePub downloads, according to the available data) and Abstracts Views on Vision4Press platform.
Data correspond to usage on the plateform after 2015. The current usage metrics is available 48-96 hours after online publication and is updated daily on week days.
Initial download of the metrics may take a while.