Fig. 5
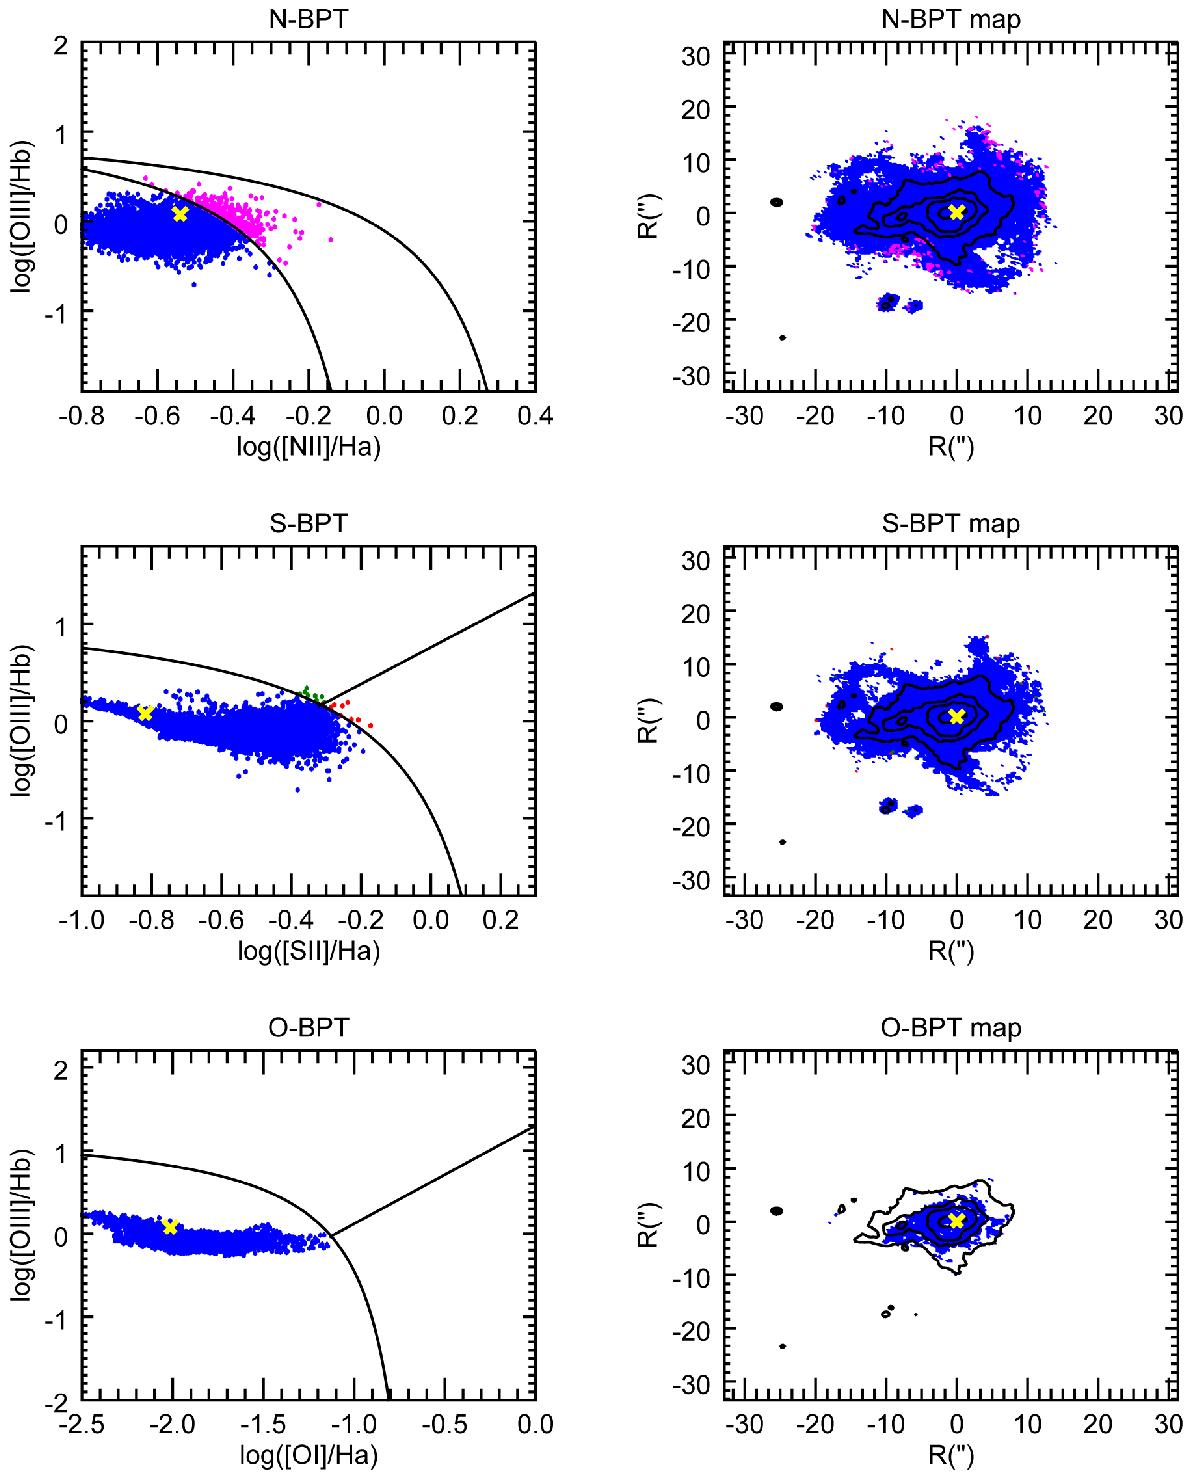
Resolved BPT diagrams for He 2-10. The N-BPT diagrams for each spaxel with S/N> 3 in each line are shown on the left; [NII]λ6584/Hα vs. [OIII]λ5007/Hβ are indicated in the upper panels, S-BPT diagrams [SII]λ6716, 30/Hα vs. [OIII]λ5007/Hβ in the central panels, and O-BPT diagrams [OI]λ6300/Hα vs. [OIII]λ5007/Hβ in the lower panels. The location of line ratios at the location of the nuclear radio source classified as accreting BH by Reines et al. (2011) are shown with a yellow cross. A map indicating each spaxel with the color corresponding to the dominant excitation at its location is shown on the right, again for spaxels with S/N> 3. The star forming regions are indicated in blue, the Seyfert-type ionization is shown in green, LINER/shock dominated regions are shown in red, and intermediate regions are shown in magenta in the N-BPT. The contours of Hα line emission are overplotted in black and the location of the radio source is indicated with a yellow cross. All the line emission is dominated by star formation like ionization in He 2-10, including at the location of the compact radio source.
Current usage metrics show cumulative count of Article Views (full-text article views including HTML views, PDF and ePub downloads, according to the available data) and Abstracts Views on Vision4Press platform.
Data correspond to usage on the plateform after 2015. The current usage metrics is available 48-96 hours after online publication and is updated daily on week days.
Initial download of the metrics may take a while.