Fig. 3
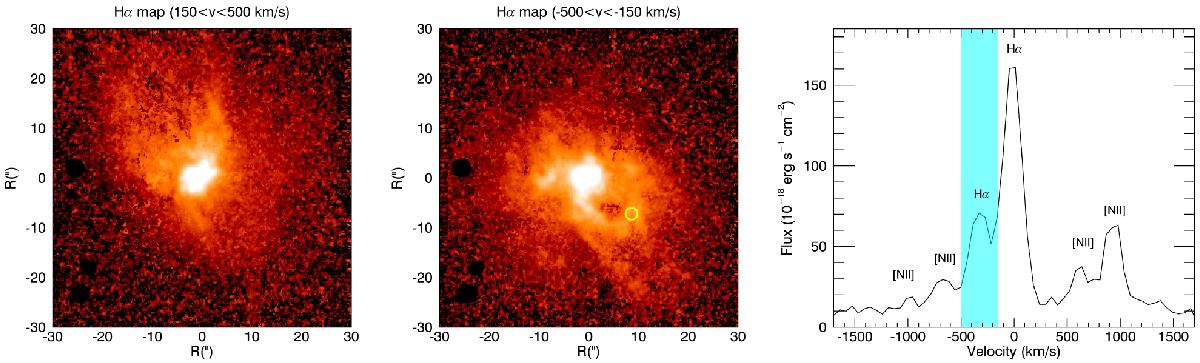
Left panel: Hα channel map between 150 <v< 500 km s-1, showing the redshifted expanding bubble to the NE. Central panel: channel map between − 500 <v< − 180 km s-1 shows the corresponding blueshifted bubble to the SW. The yellow circle indicates the spaxels from which the spectrum of the [NII] and Hα region shown in the right panel is extracted. The double-peaked profile of Hα and [NII] is evident with a shift between the two peaks of 310 km s-1. The shaded cyan region indicates the velocity range used for the channel map shown in the central panel.
Current usage metrics show cumulative count of Article Views (full-text article views including HTML views, PDF and ePub downloads, according to the available data) and Abstracts Views on Vision4Press platform.
Data correspond to usage on the plateform after 2015. The current usage metrics is available 48-96 hours after online publication and is updated daily on week days.
Initial download of the metrics may take a while.