Fig. 2
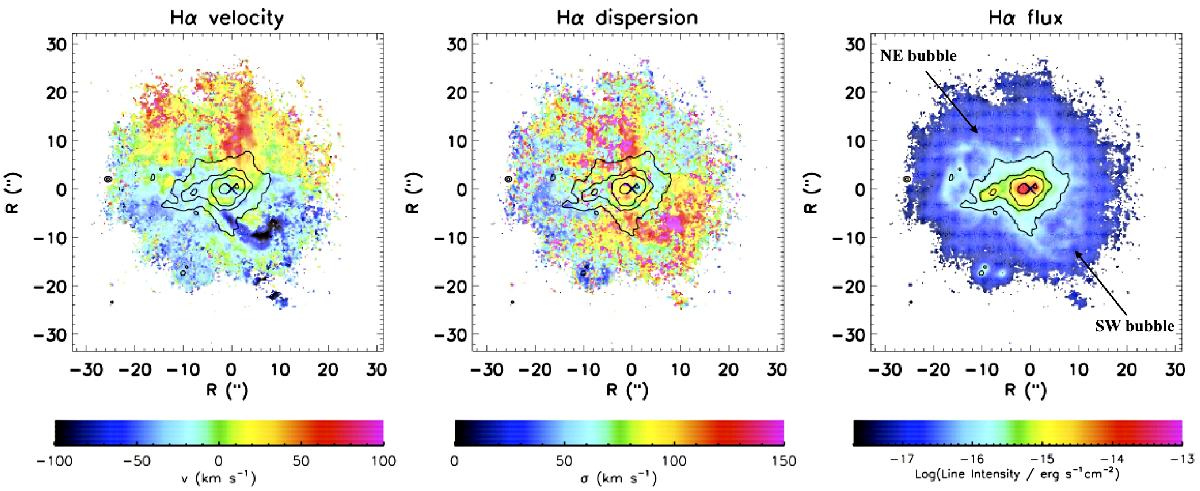
Gas kinematics from the combined fit of the emission lines in He 2-10. Left panel: ionized gas velocity relative to the systemic velocity of 873 km s-1 derived from the integrated spectrum is shown; σ velocity dispersion of the total line profile, corrected for instrumental effects, is shown. Right panel: Hα map is plotted as reference, with the location of the blueshifted SW bubble and redshifted NE bubble denoted. The contours of the Hα line emission are shown in each panel along with the location of the radio source identified with a cross, and all maps show the spaxels with S/N> 3 in Hα. The expanding bubbles both in approaching and receding velocities are evident in the maps.
Current usage metrics show cumulative count of Article Views (full-text article views including HTML views, PDF and ePub downloads, according to the available data) and Abstracts Views on Vision4Press platform.
Data correspond to usage on the plateform after 2015. The current usage metrics is available 48-96 hours after online publication and is updated daily on week days.
Initial download of the metrics may take a while.