Fig. 1
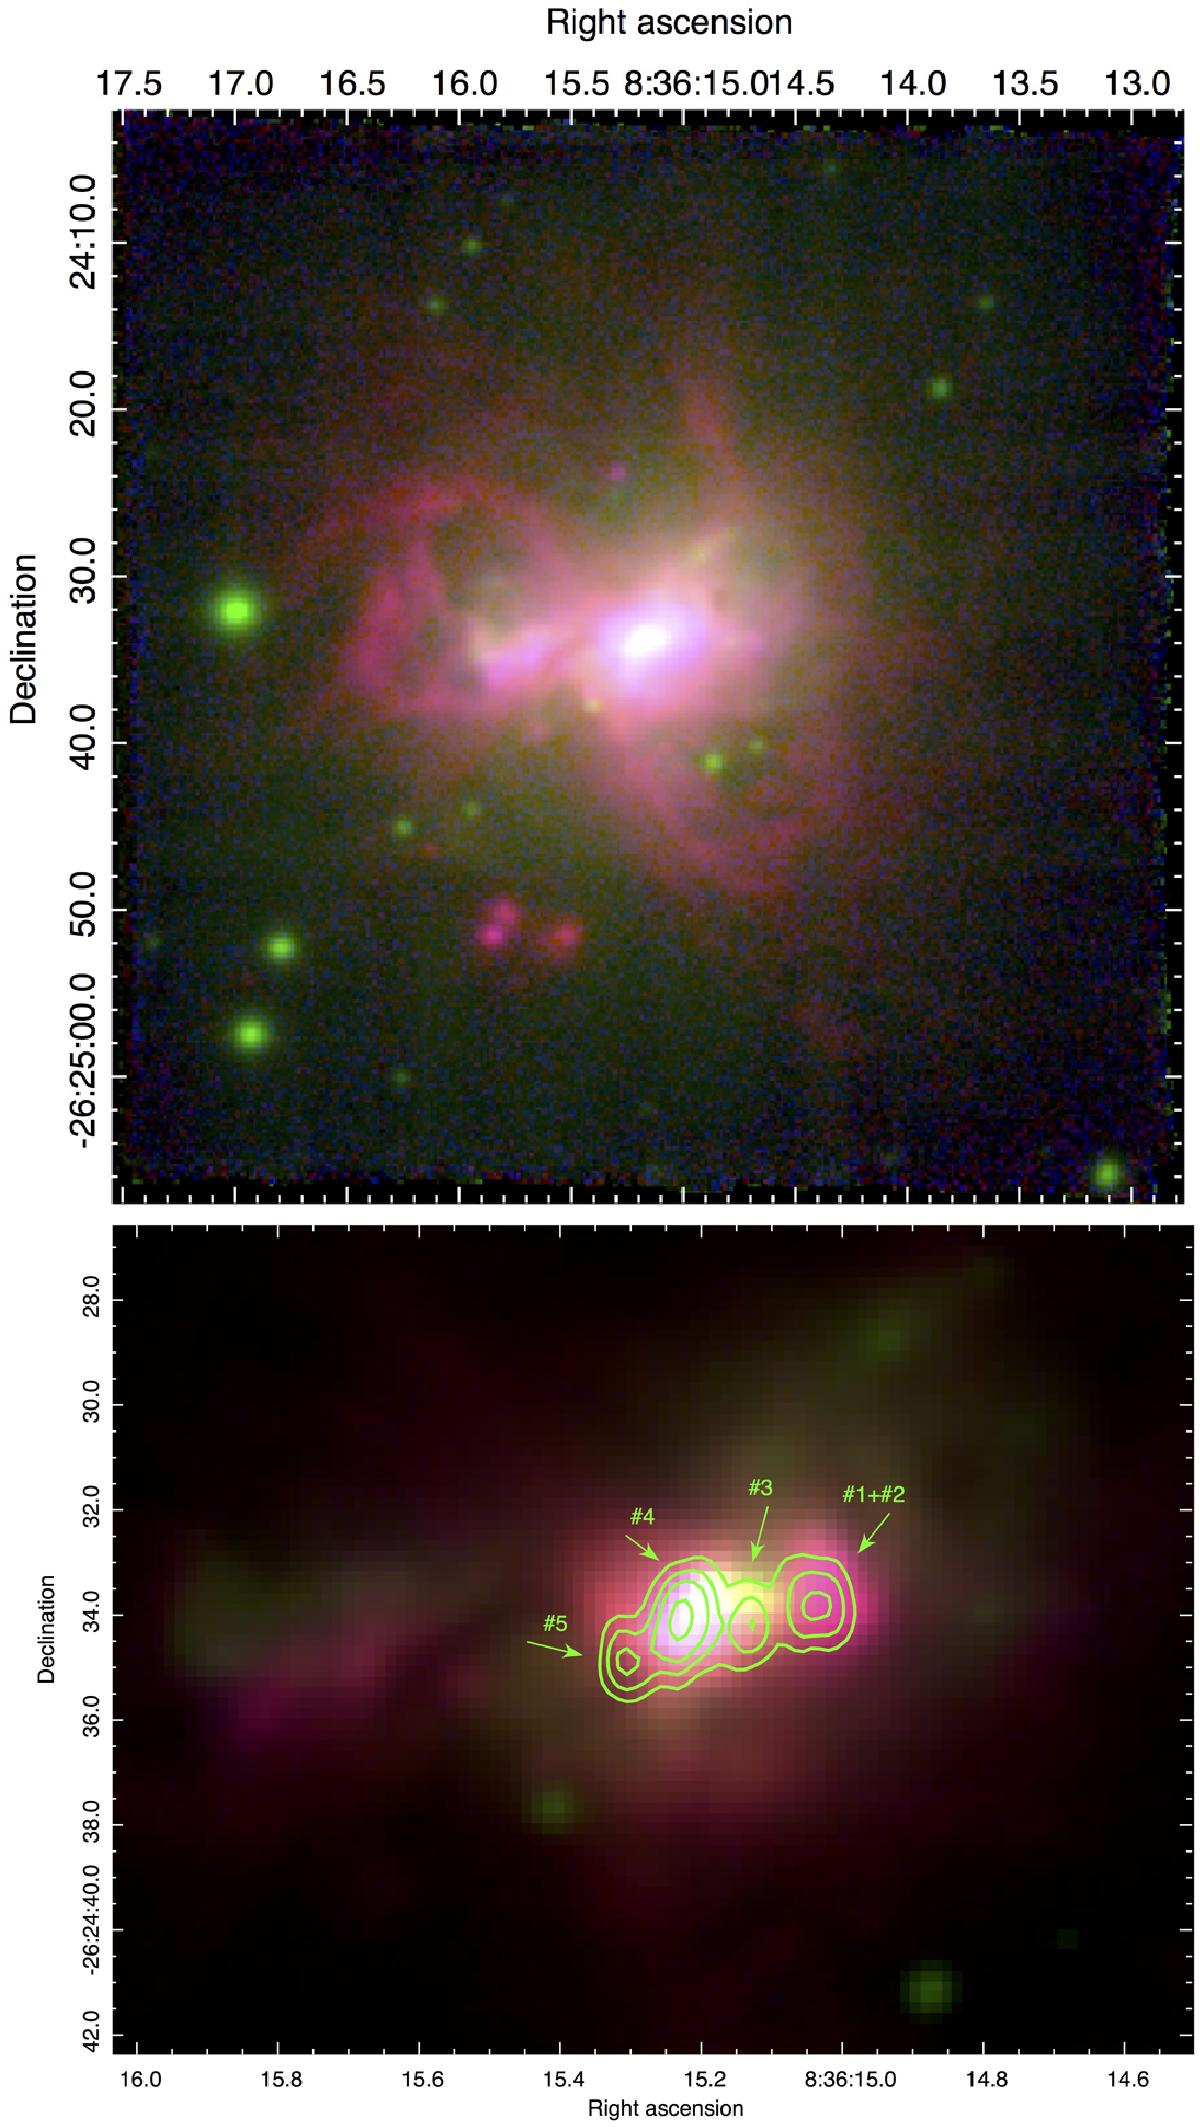
Three-color MUSE images of the galaxy He 2-10. The full MUSE field of view (1′ × 1′) is shown in the upper panel: the continuum over the entire spectral range is shown in green, the [OIII]λ5007 emission in blue, and the Hα emission in red. An enlarged view of the central regions of the galaxy (20′′ × 15′′) is instead shown in the lower panel, with the radio continuum contours at 3.6 cm obtained by Johnson & Kobulnicky (2003) overplotted, along with their notation for the main radio knots 1-5. North is up and east is left.
Current usage metrics show cumulative count of Article Views (full-text article views including HTML views, PDF and ePub downloads, according to the available data) and Abstracts Views on Vision4Press platform.
Data correspond to usage on the plateform after 2015. The current usage metrics is available 48-96 hours after online publication and is updated daily on week days.
Initial download of the metrics may take a while.