Fig. 8
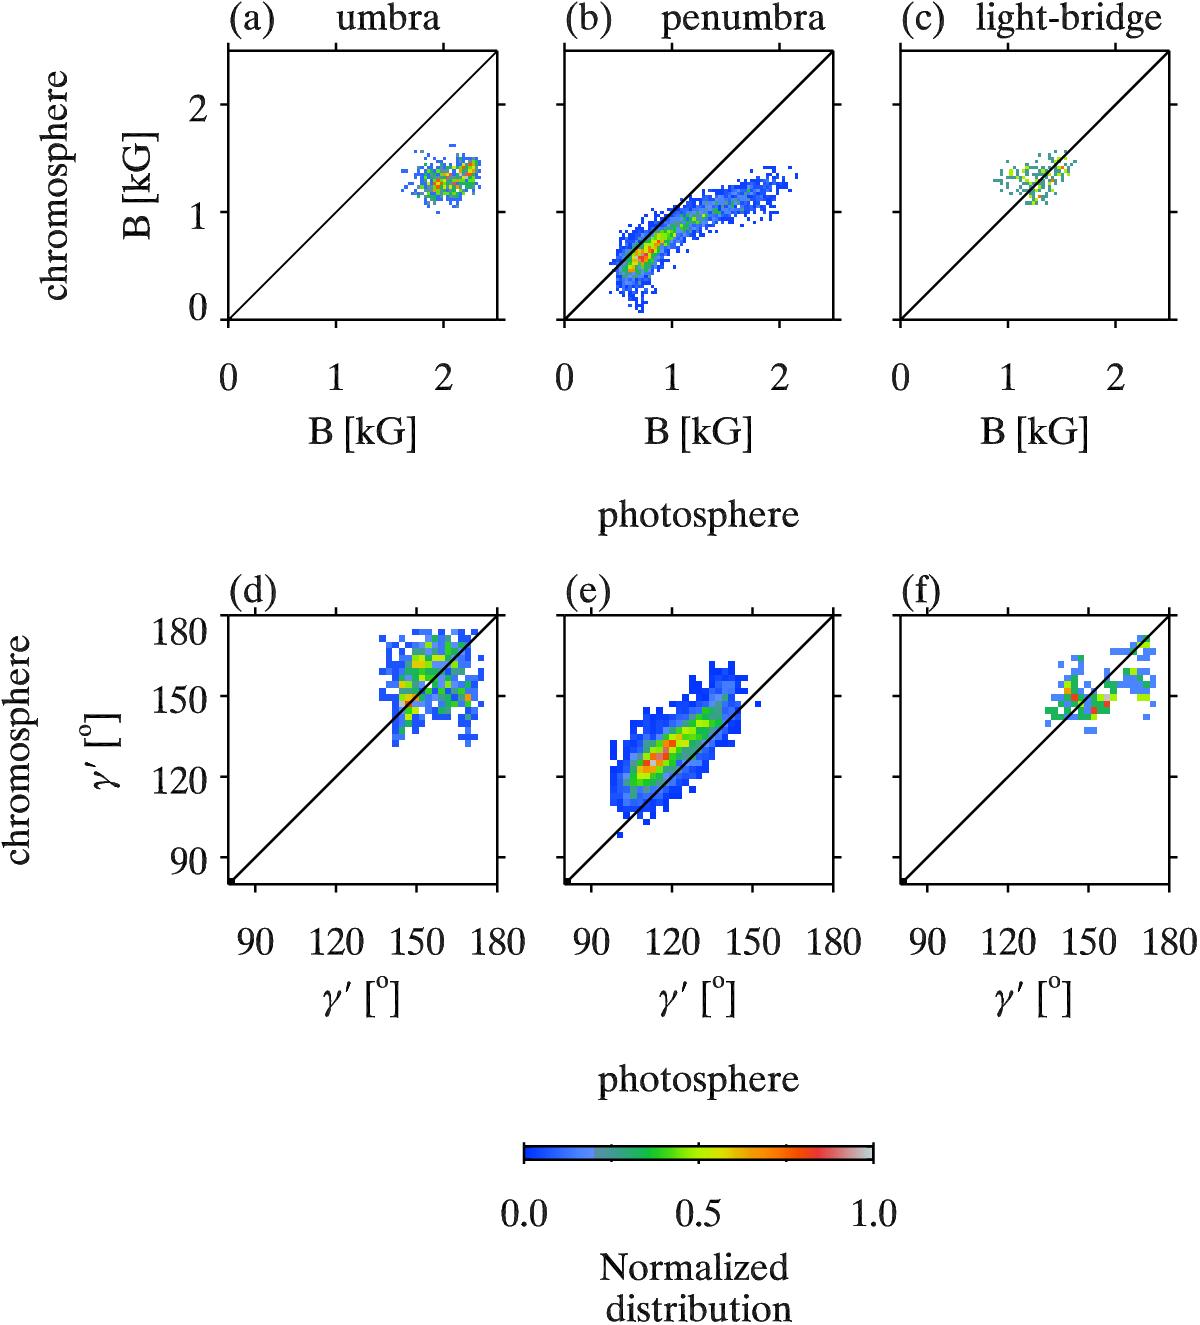
Two-dimensional histograms of the magnetic field components obtained in the upper chromosphere vs. those obtained in the photosphere from the observations recorded on 14 November 2010. Panels a–c show plots of B from the umbral, penumbral , and lightbridge pixels, respectively (see Fig. 7). The γ′ values of data points from the same spatial positions are shown in panels d–f, respectively.
Current usage metrics show cumulative count of Article Views (full-text article views including HTML views, PDF and ePub downloads, according to the available data) and Abstracts Views on Vision4Press platform.
Data correspond to usage on the plateform after 2015. The current usage metrics is available 48-96 hours after online publication and is updated daily on week days.
Initial download of the metrics may take a while.