Fig. 4
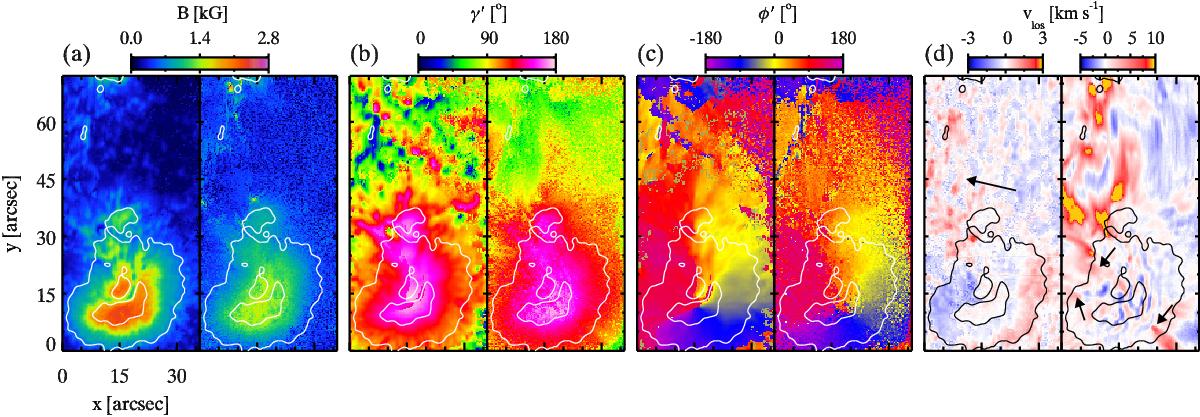
Maps of a) Magnetic field strength B, b) inclination angle, γ′, of the magnetic field vector with respect to the solar surface normal, c) azimuth direction, φ′, of the magnetic field vector and d) line-of-sight velocity obtained from the observations recorded on 14 November 2010. Left and right maps in all panels represent atmospheric parameters obtained in the photosphere and upper chromosphere, respectively. An arrow in the left map of panel d indicates the disk center direction and three arrows in the right map point three downflow intrusions in the penumbra.
Current usage metrics show cumulative count of Article Views (full-text article views including HTML views, PDF and ePub downloads, according to the available data) and Abstracts Views on Vision4Press platform.
Data correspond to usage on the plateform after 2015. The current usage metrics is available 48-96 hours after online publication and is updated daily on week days.
Initial download of the metrics may take a while.