Fig. 14
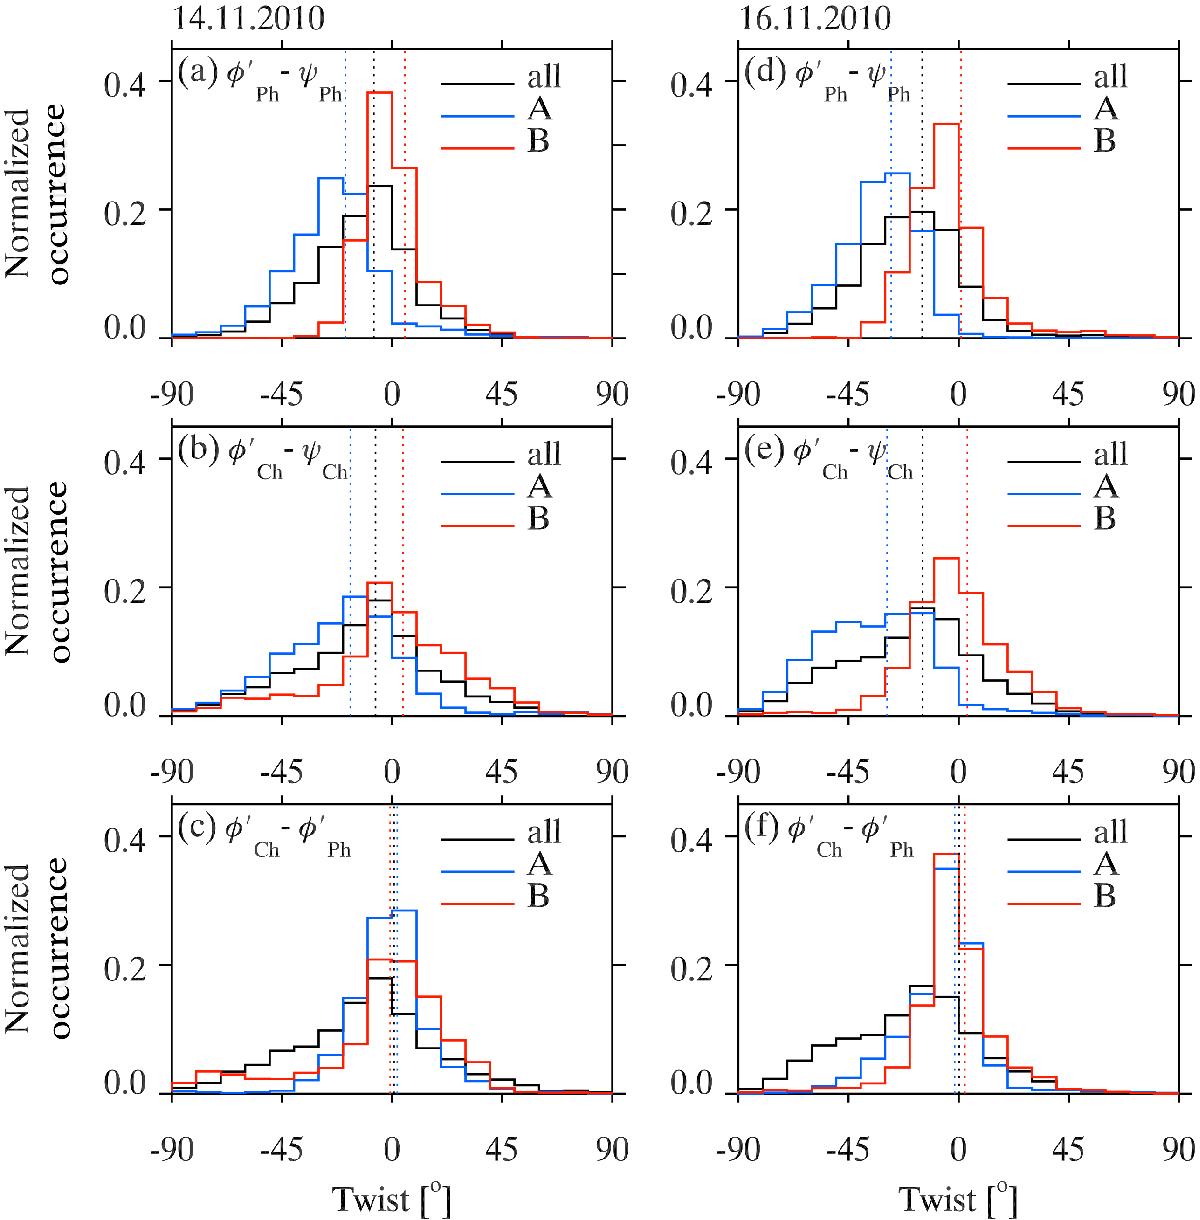
Histograms of the twist and differential twist of the magnetic field of the sunspot, with the differential twist denoting the difference between the azimuthal direction of the field in the photosphere, ![]() and chromosphere,
and chromosphere, ![]() . Panels a and d represent
. Panels a and d represent ![]() . Panels b and e represent
. Panels b and e represent ![]() . Panels c and f represent
. Panels c and f represent ![]() . Blue, red, and black histograms are derived from pixels in the right, left, and all parts of the sunspot, respectively (the right and left part is separated by a line in Fig. 13). Dotted vertical lines represent the average twist. Panels in the left and right columns correspond to the observations recorded on 14 November 2010 and 16 November 2010, respectively.
. Blue, red, and black histograms are derived from pixels in the right, left, and all parts of the sunspot, respectively (the right and left part is separated by a line in Fig. 13). Dotted vertical lines represent the average twist. Panels in the left and right columns correspond to the observations recorded on 14 November 2010 and 16 November 2010, respectively.
Current usage metrics show cumulative count of Article Views (full-text article views including HTML views, PDF and ePub downloads, according to the available data) and Abstracts Views on Vision4Press platform.
Data correspond to usage on the plateform after 2015. The current usage metrics is available 48-96 hours after online publication and is updated daily on week days.
Initial download of the metrics may take a while.