Fig. 12
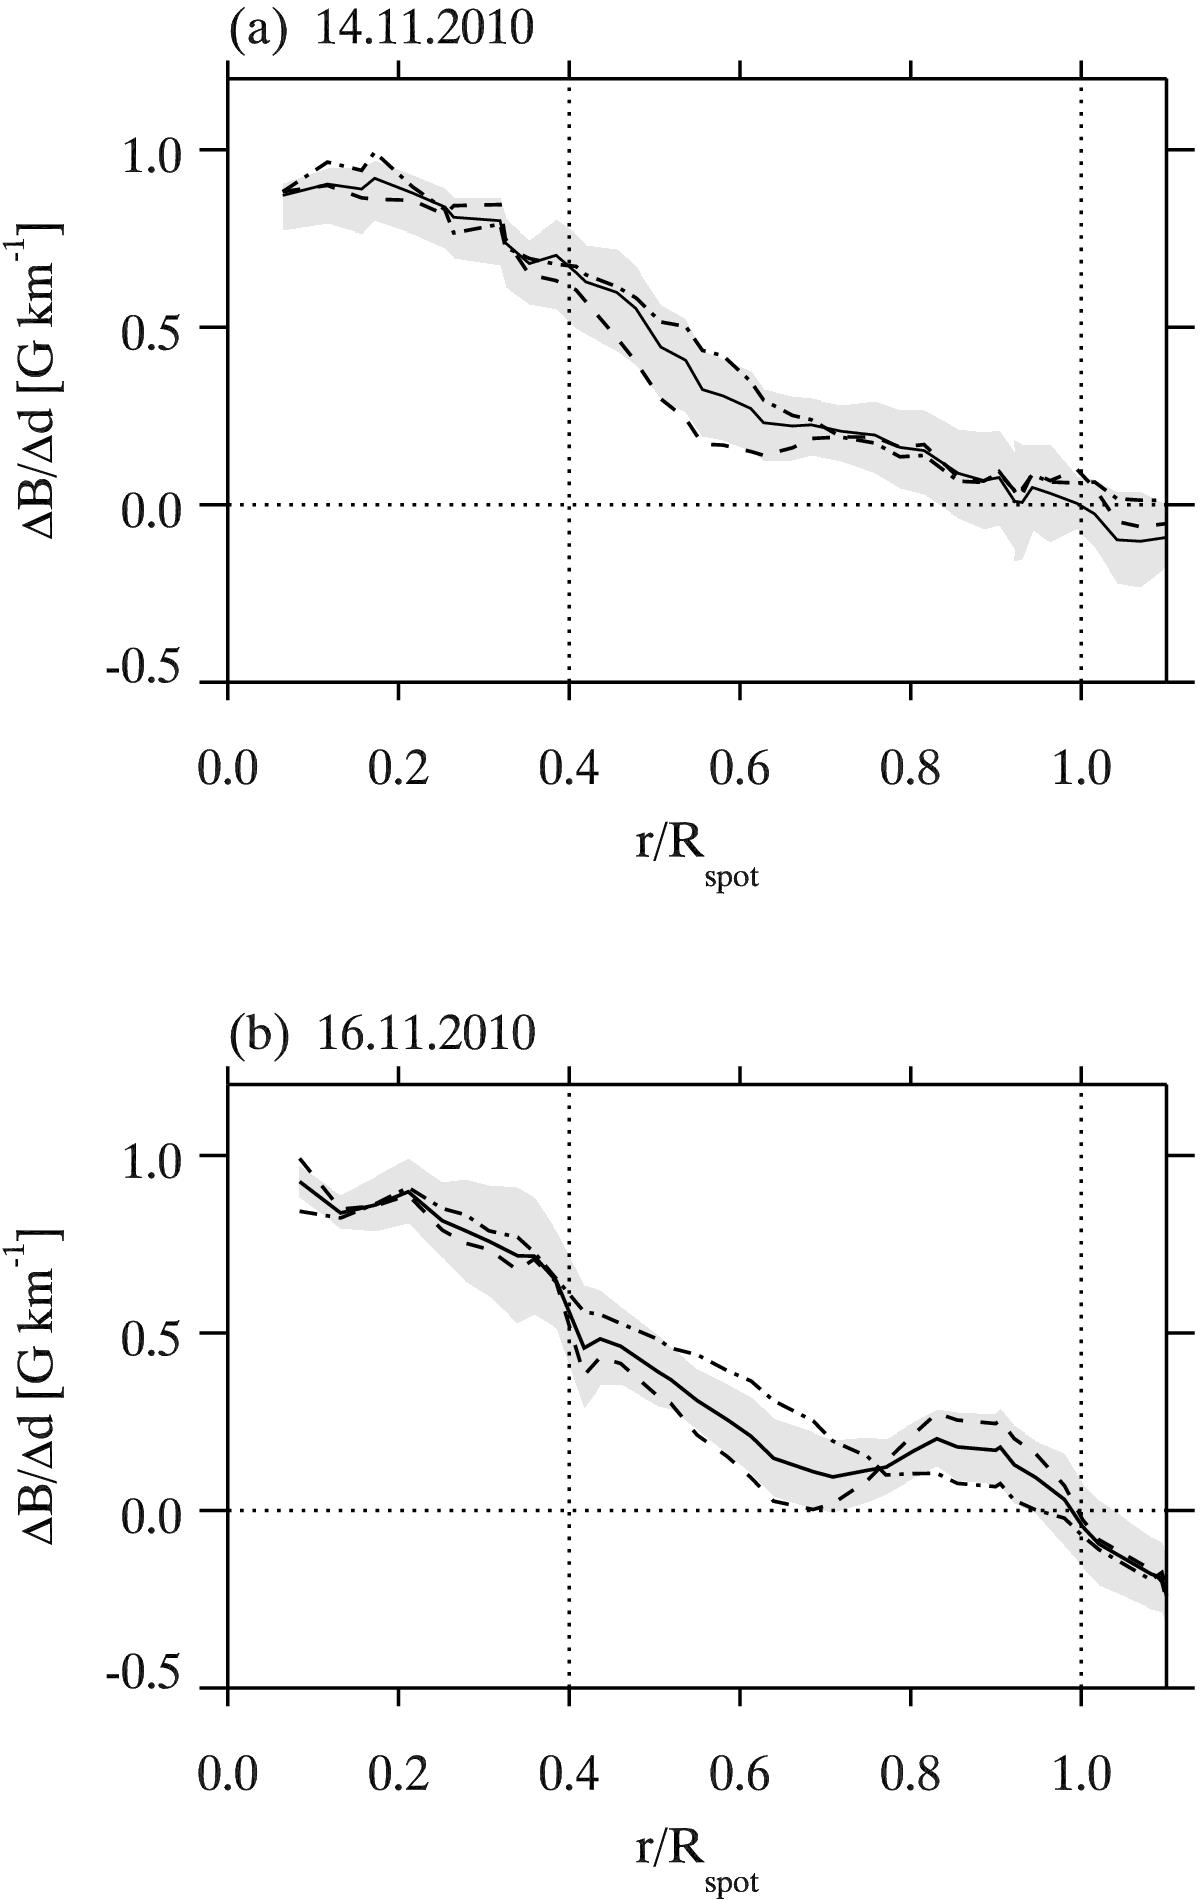
Vertical gradient of B, ΔB/ Δd, between the photosphere and upper chromosphere as a function of r/Rspot. Solid curves represent ΔB/ Δd estimated with the average value of B in the photosphere. Dashed and dot-dashed curves show ΔB/ Δd from log τ = 0.0 and log τ = − 2.3, respectively. Panels a and b correspond to 14 and 16 November 2010, respectively.
Current usage metrics show cumulative count of Article Views (full-text article views including HTML views, PDF and ePub downloads, according to the available data) and Abstracts Views on Vision4Press platform.
Data correspond to usage on the plateform after 2015. The current usage metrics is available 48-96 hours after online publication and is updated daily on week days.
Initial download of the metrics may take a while.