Fig. 1
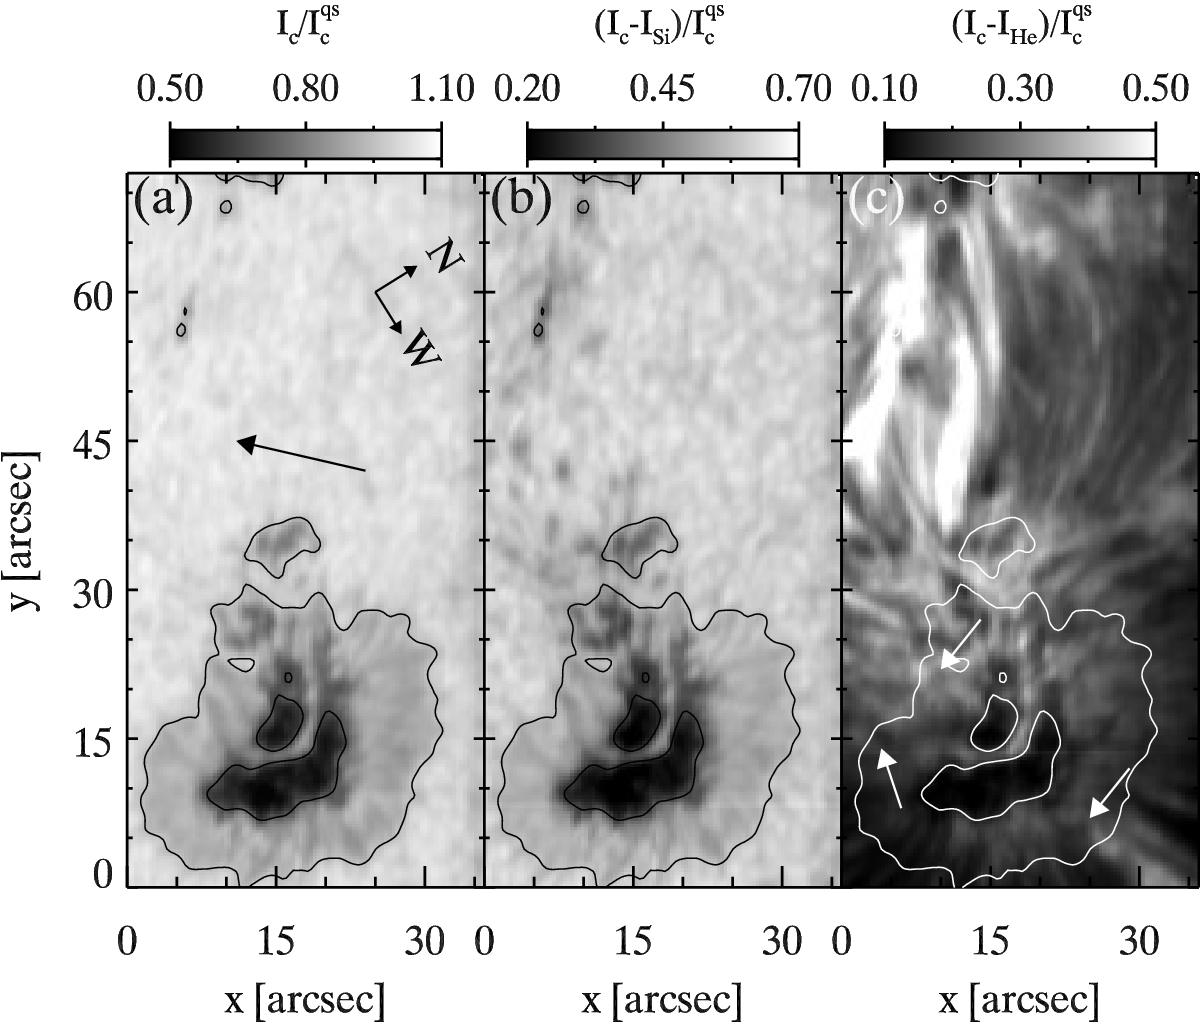
Panel a: observed field-of-view (FOV) on 14 November 2010 in the continuum. Panels b and c: depression of the line core of the Si i 10 827 Å line and He ibc, respectively. The inner and outer contours in all panels indicate the umbra-penumbra boundary and the outer boundary of the sunspot, respectively. The arrow in panel a indicates the direction to the solar disk center. Three white arrows in panel c mark positions of downflow intrusions in the penumbra in the upper chromosphere (see Fig. 4d).
Current usage metrics show cumulative count of Article Views (full-text article views including HTML views, PDF and ePub downloads, according to the available data) and Abstracts Views on Vision4Press platform.
Data correspond to usage on the plateform after 2015. The current usage metrics is available 48-96 hours after online publication and is updated daily on week days.
Initial download of the metrics may take a while.