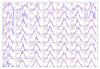
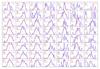
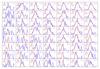
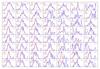
Fig. 9

Map of spectra recorded in individual spaxels. The total area corresponds to the dashed rectangle in Fig. 8; it covers 14 × 16 spaxels (2.8′′×3.2′′). North is up and east to the left. The blue lines show the measured spectra, and the red curves the Gaussian fits. The spectral range is 4955–4980 Å. The black number inside each subplot (top left corner) is the peculiar velocity in km s-1 computed from the Gaussian fit; the red number just below is the FWHM of the emission line in km s-1; the purple number (top right) is the amplitude of the Gaussian in units of 10-20 erg s-1 cm-2 Å-1 spaxel-1. The dashed vertical line marks the average emission wavelength (4970.0 Å). The quasar lies in the upper left quadrant, in the spaxel [7, 5] just next to spaxel [7, 4] (where [1, 1] and [7, 8] define the lower left and upper right spaxels).
Current usage metrics show cumulative count of Article Views (full-text article views including HTML views, PDF and ePub downloads, according to the available data) and Abstracts Views on Vision4Press platform.
Data correspond to usage on the plateform after 2015. The current usage metrics is available 48-96 hours after online publication and is updated daily on week days.
Initial download of the metrics may take a while.