Free Access
Fig. 5
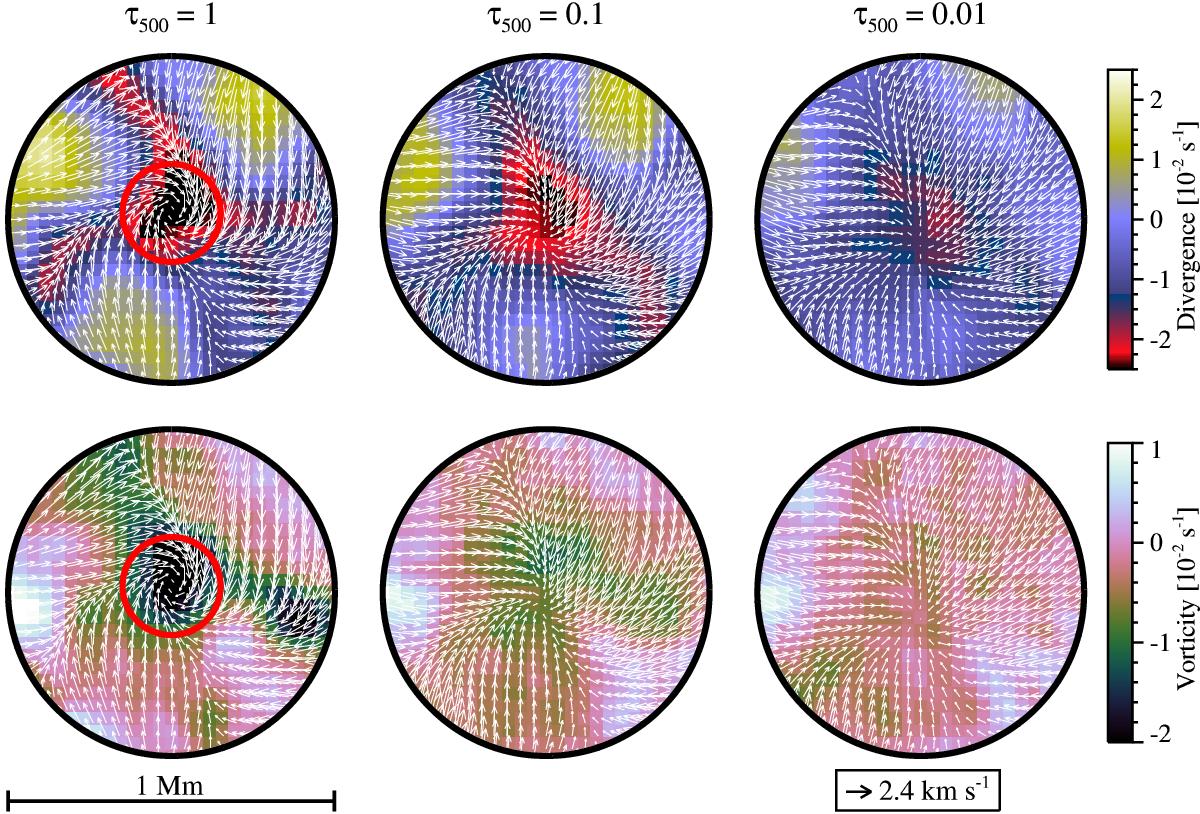
Close-up of the small-scale vortex flow shown in Fig. 3 with red circles. The upper panels show the divergence of the horizontal velocity field at the three selected heights, while the lower panels represent the vertical vorticity. Red circles (with a radius of 150 km) show the size of the small-scale vortex flow.
Current usage metrics show cumulative count of Article Views (full-text article views including HTML views, PDF and ePub downloads, according to the available data) and Abstracts Views on Vision4Press platform.
Data correspond to usage on the plateform after 2015. The current usage metrics is available 48-96 hours after online publication and is updated daily on week days.
Initial download of the metrics may take a while.