Fig. 4
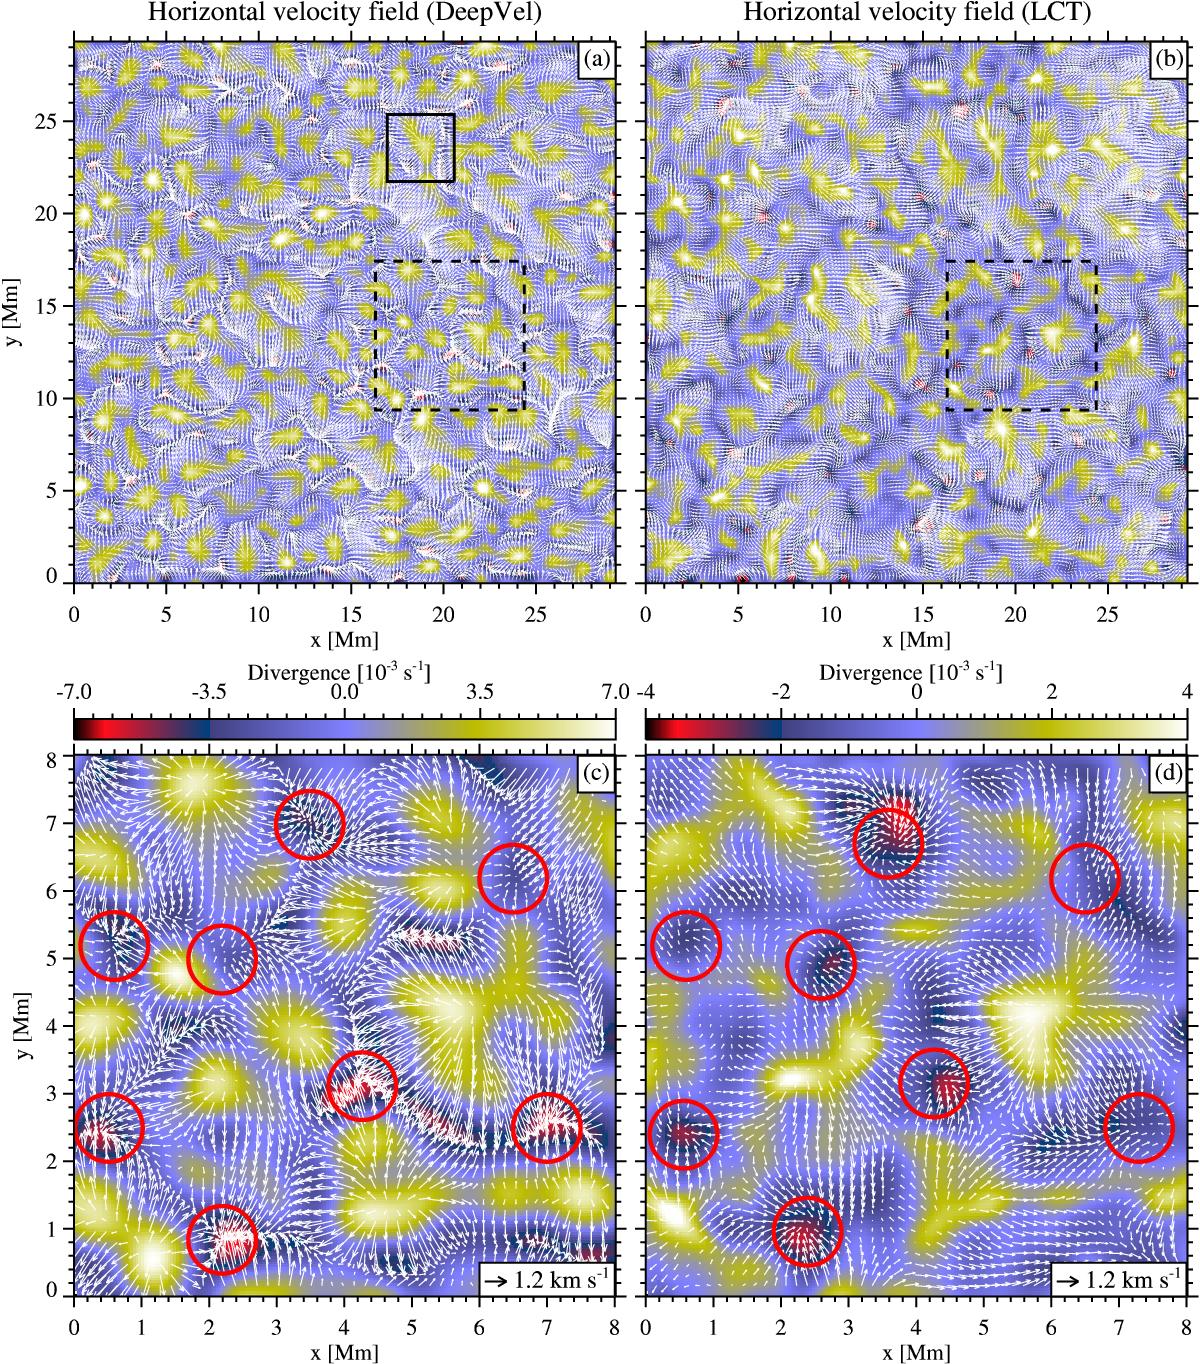
Average horizontal velocity field (white arrows) and divergence maps (background images) for the FOV of IMaX computed by DeepVel a) and LCT b), respectively. The black solid box indicates the region analyzed in Fig. 3. Close-ups of the black dashed rectangles are shown in panels c) and d) for DeepVel and LCT, respectively. Red circles represent the locations of converging flows.
Current usage metrics show cumulative count of Article Views (full-text article views including HTML views, PDF and ePub downloads, according to the available data) and Abstracts Views on Vision4Press platform.
Data correspond to usage on the plateform after 2015. The current usage metrics is available 48-96 hours after online publication and is updated daily on week days.
Initial download of the metrics may take a while.