Fig. 3
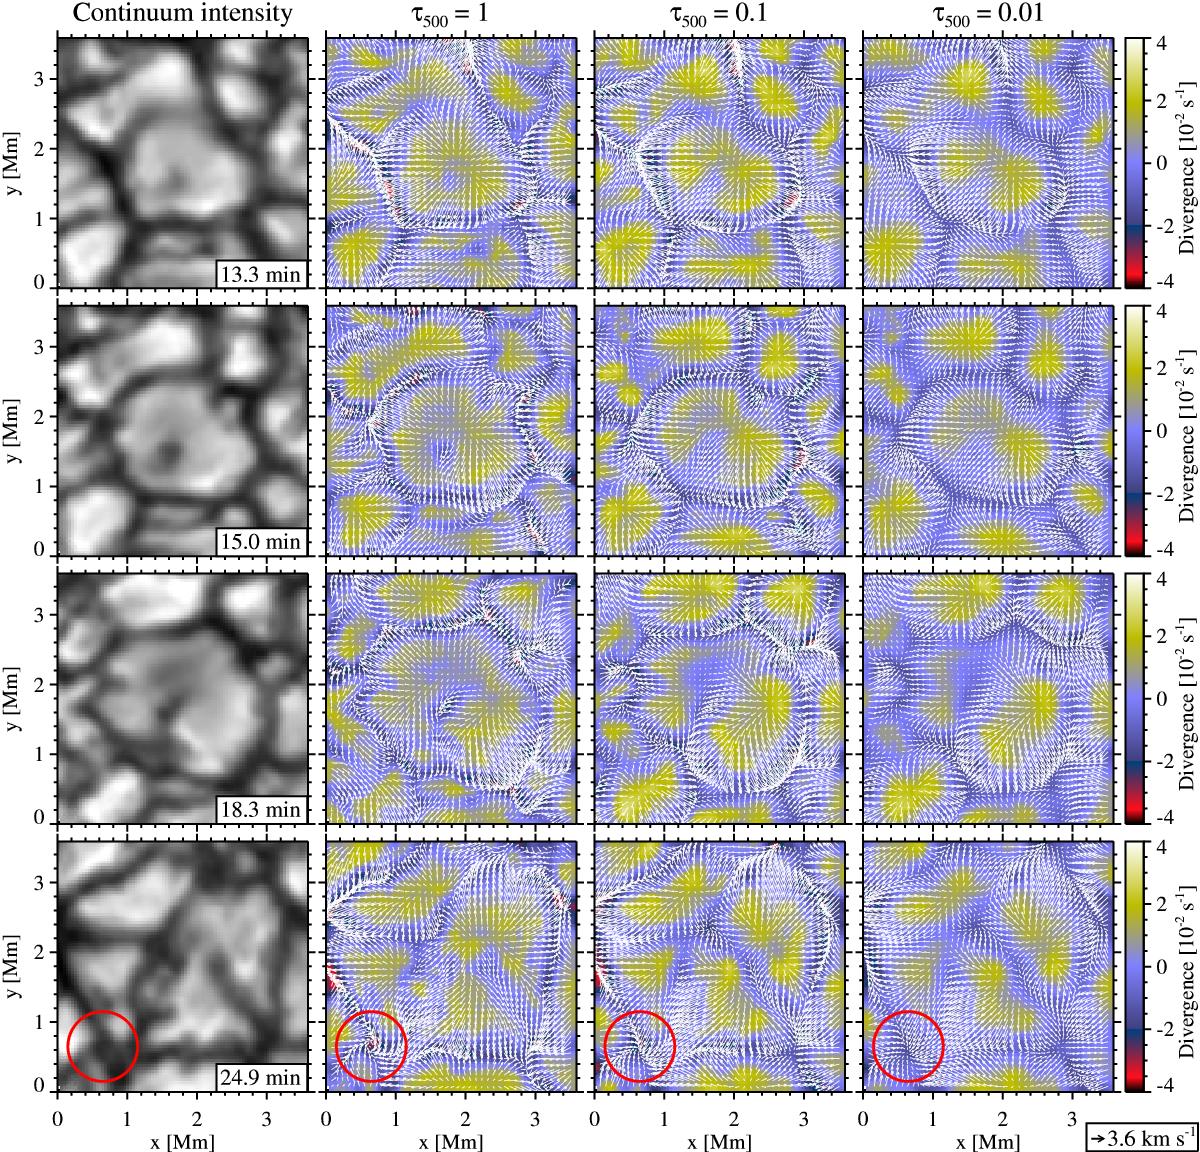
Evolution of granules as seen in close-ups of continuum intensity maps (left column) and the instantaneous horizontal velocity field (white arrows) and divergence maps (background images) at three heights in the atmosphere (right columns), corresponding to τ500 = 1,0.1,0.01. The area is located within the black solid rectangle in Fig. 4a. Red circles (with a radius of 0.5 Mm) in the bottom row indicate the location of a small-scale vortex flow. Elapsed time is given in the lower right corner of each continuum image. The arrow at the lower right corner can be used to estimate visually the amplitude of the velocity field. The whole evolution is presented in the online movie.
Current usage metrics show cumulative count of Article Views (full-text article views including HTML views, PDF and ePub downloads, according to the available data) and Abstracts Views on Vision4Press platform.
Data correspond to usage on the plateform after 2015. The current usage metrics is available 48-96 hours after online publication and is updated daily on week days.
Initial download of the metrics may take a while.