Fig. 7
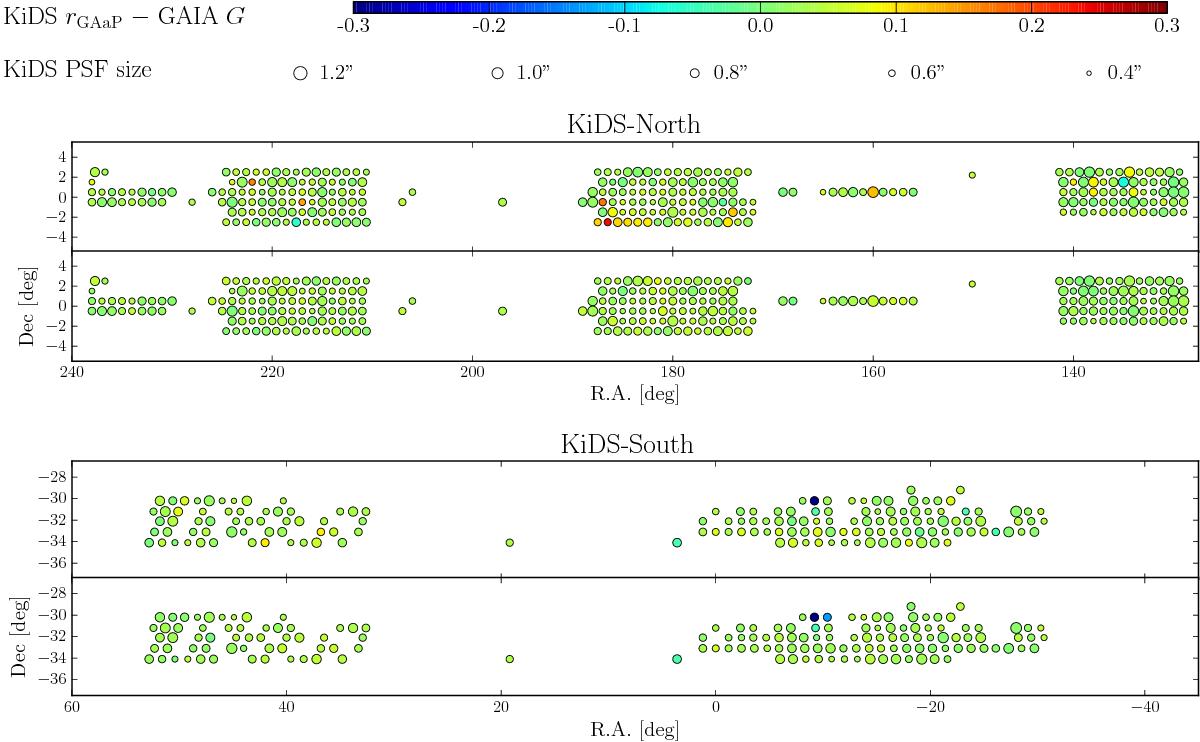
Comparison of KiDS r-band to Gaia G-band photometry as function of position on the sky. The per-tile median photometric offset (rGAaP − G) is indicated by the colour scale, while the marker size corresponds to the mean seeing in the KiDS r-band image. Top: comparison for KiDS-North, with in the top and bottom subpanels showing the offsets before and after applying the photometric homogenization, respectively. Bottom: same as the top panel, but now for KiDS-South.
Current usage metrics show cumulative count of Article Views (full-text article views including HTML views, PDF and ePub downloads, according to the available data) and Abstracts Views on Vision4Press platform.
Data correspond to usage on the plateform after 2015. The current usage metrics is available 48-96 hours after online publication and is updated daily on week days.
Initial download of the metrics may take a while.