Fig. 2
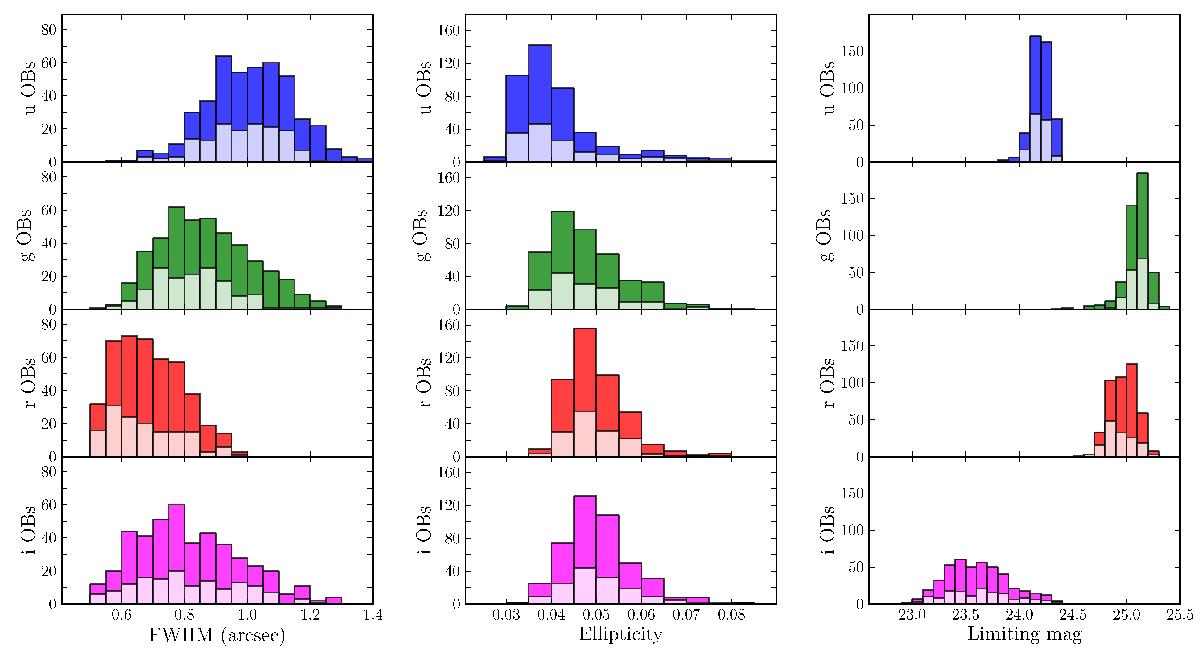
Data quality for KiDS-ESO-DR1 -DR2 and -DR3. Left: average PSF size (FWHM) distributions; centre: average PSF ellipticity distributions; right: limiting magnitude distributions (5σ AB in 2′′ aperture). The distributions are per filter: from top to bottom u, g, r, and i, respectively. The full histograms correspond to the 440 tiles included in the DR3 multi-band catalogue, while the lighter portions of the histograms correspond to fraction (148 tiles) previously released in KiDS-ESO-DR1 and -DR2.
Current usage metrics show cumulative count of Article Views (full-text article views including HTML views, PDF and ePub downloads, according to the available data) and Abstracts Views on Vision4Press platform.
Data correspond to usage on the plateform after 2015. The current usage metrics is available 48-96 hours after online publication and is updated daily on week days.
Initial download of the metrics may take a while.