Fig. 7
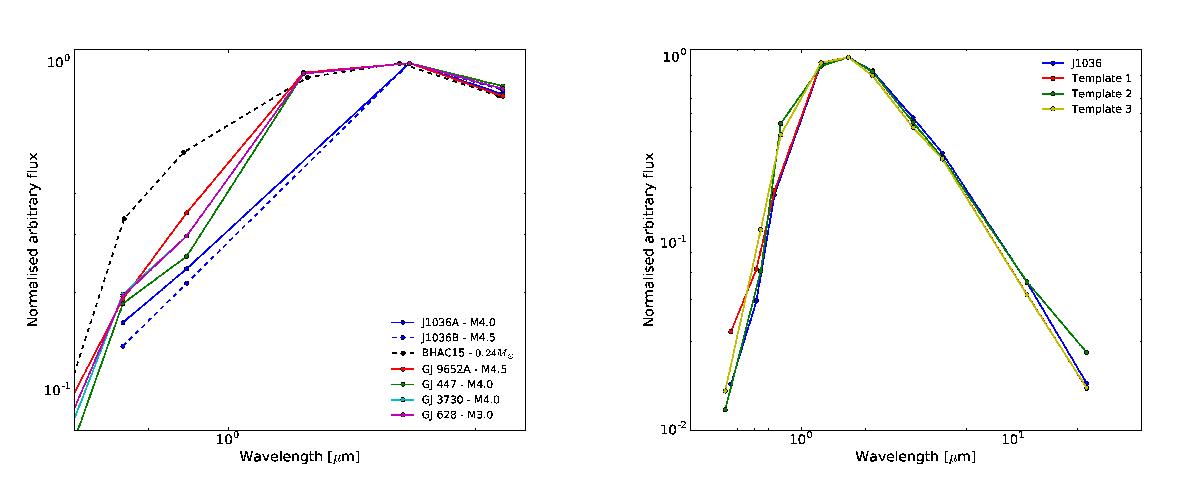
Spectral energy distribution of J1036 plotted together with several reference stars of the different spectral types (Shkolnik et al. 2012). The left plot displays the A and B components of J1036 as the blue solid and dashed line respectively. We also include a dashed black line representing the Baraffe et al. (2015) 500 Myr isochrone model for the same mass as estimated for J1036B of 0.24 M⊙. The major differences in shape between the lines stem from the incompleteness of observational data of J1036 in the 1.0 − 1.6 μm wavelength region. There is also a hint of reddening in J1036 as the magnitude seems to drops off at lower wavelengths. The right plot displays the unresolved J1036 system plotted together with three composite template systems of reference stars of the same spectral types as J1036ABC. The bands used in the SED are g′r′i′JHKw1w2w3w4 for J1036 and Template 1 and bands BRIJHKw1w2w3w4 for Template 2 and Template 3. Section 4.1 contains further information on the three composite templates. The templates fit well with the expected spectral types of J1036 and there are no signs of extreme reddening from the unresolved J1036 system. All lines have been normalised to their respective maximum value, which is represented here by the H-band magnitude for all cases.
Current usage metrics show cumulative count of Article Views (full-text article views including HTML views, PDF and ePub downloads, according to the available data) and Abstracts Views on Vision4Press platform.
Data correspond to usage on the plateform after 2015. The current usage metrics is available 48-96 hours after online publication and is updated daily on week days.
Initial download of the metrics may take a while.